µ¦µ
10.3
¤¼
¨n
µ·
o
µ
µ°°
10
°´
´
¦
°Å¥ Î
µÂÁ}
¦µ¥¦³Á«¸É
Î
µ´
¡.«.
2557 - 2558
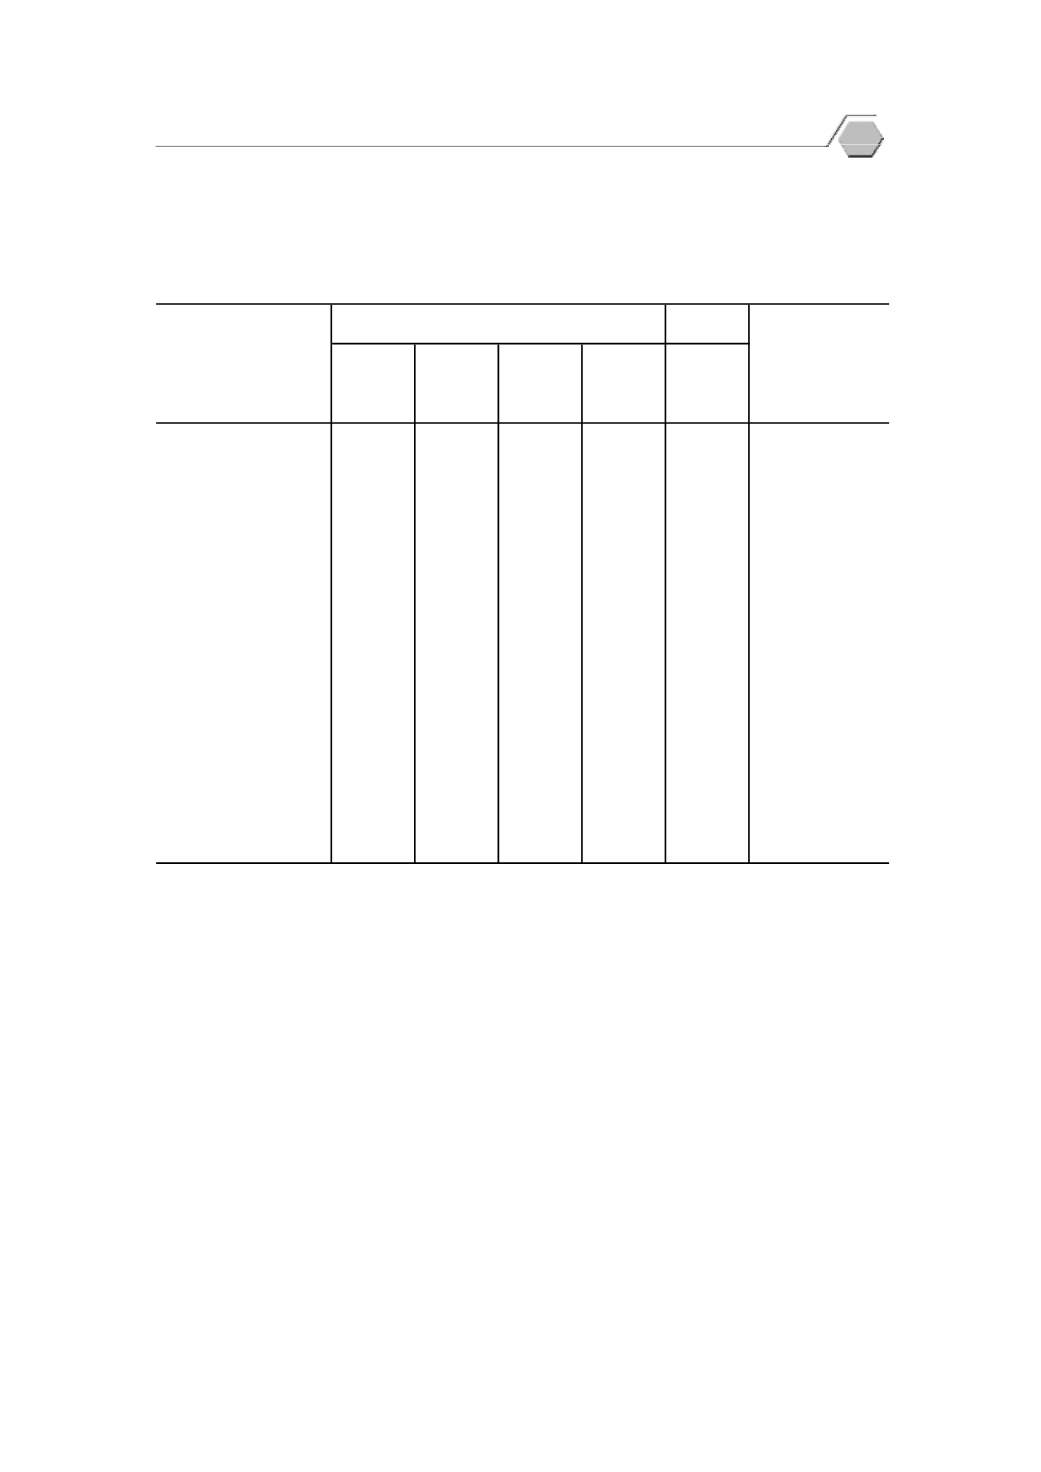
TABLE 10.3
Top Ten Value of Exports of Thailand by Principal Country
: 2014 - 2015
(¨o
µµ
Million Baht
)
2558 (2015)
Ŧ¤µ¸É
1 Ŧ¤µ¸É
2 Ŧ¤µ¸É
3 Ŧ¤µ¸É
4 Ŧ¤µ¸É
1
Quarter
1
Quarter
2
Quarter
3
Quarter
4
Quarter
1
®¦´
°Á¤¦·
µ......................................
179,390.9 189,799.5 194,227.6 204,438.2 189,913.0
U.S.A.
¸
..........................................................
211,269.8 187,562.3 199,005.9 208,599.6 181,254.8
China
¸É
»i
.....................................................
182,825.6 170,761.2 172,954.9 174,992.9 166,483.6
Japan
±n
°..................................................
107,261.1 98,184.7 104,932.3 94,888.3 95,197.3
Hong Kong
¤µÁ¨Á¸
¥................................................
99,580.3 104,328.8 100,465.9 105,912.3 85,255.9
Malaysia
°°Á¦Á¨¸
¥..........................................
70,127.1 66,814.8 76,005.0 85,947.5 76,951.5
Australia
°·
ø
Á¸
¥............................................
78,039.3 82,274.6 75,714.2 69,625.8 66,153.8
Indonesia
·
ær
................................................
69,464.9 87,307.6 96,316.1 82,588.8 65,880.5
Singapore
Áª¸
¥µ¤..............................................
53,151.8 60,671.3 67,612.9 72,020.4 62,911.8
Vietnam
¢d
¨·
d
r
..............................................
43,039.4 43,649.5 50,554.0 51,266.2 46,326.1
Philippines
¸É
¤µ:
Î
µ´
µ¨´
¦³¦ª¡µ·
¥r
¦³¦ª¡µ·
¥r
Source
:
Office of the Permanent Secretary, Ministry of Commerce
2557 (2014)
¦³Á«
Country
67
Trade and Price Statistics


