Î
µÂµ¤®¤ª·
o
µ ¡.«.
2557 - 2558
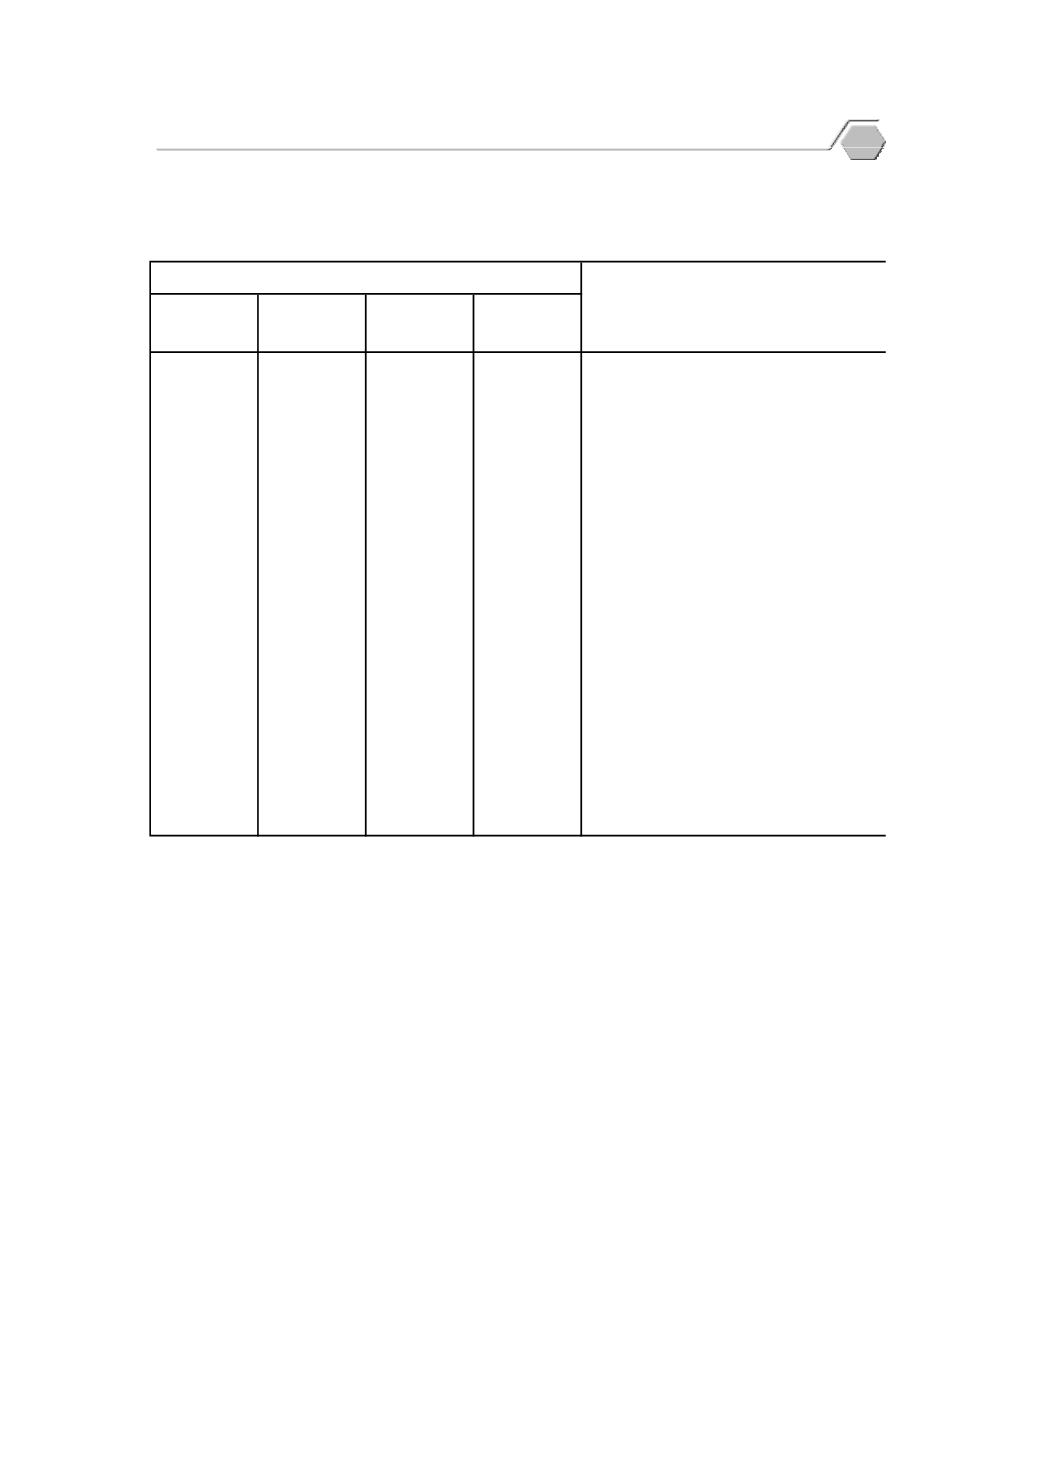
by Commodity Group
: 2014 - 2015
[2553 (2010) = 100]
122.30
123.20
122.10
121.70
152.80
152.10
153.10
153.10
Lumber and wood products
118.60
118.60
118.60
118.60
Cement
134.40
134.40
134.40
134.40
Concrete ingredient
103.20
106.10
102.80
100.80
Iron products
111.80
111.80
111.80
111.80
Tiles
120.90
120.90
120.90
120.90
Paints
155.80
155.80
155.80
155.80
Sanitary ware
105.80
106.10
105.50
105.80
Electrical and plumbing
149.70
150.10
149.30
149.60
Others
Source: Bureau of Trade and Economic Indices, Office of the Permanent Secretary, Ministry of Commerce
Ŧ¤µ¸É
1/2558
Quarter
1/2015
All items
March
»
¤£µ¡´
r
February
January
Total Index
Commodity group
¤¸
µ¤
´
¸
¦ª¤
¤¦µ¤
87
Trade and Price Statistics


