µ¦µ
3.1
´
Á¦¸
¥ ·
·
´
«¹
¬µ Î
µÂµ¤¦³´
µ¦«¹
¬µ ´Ê
Á¦¸
¥ ¨³Á¡« e
µ¦«¹
µ
2556
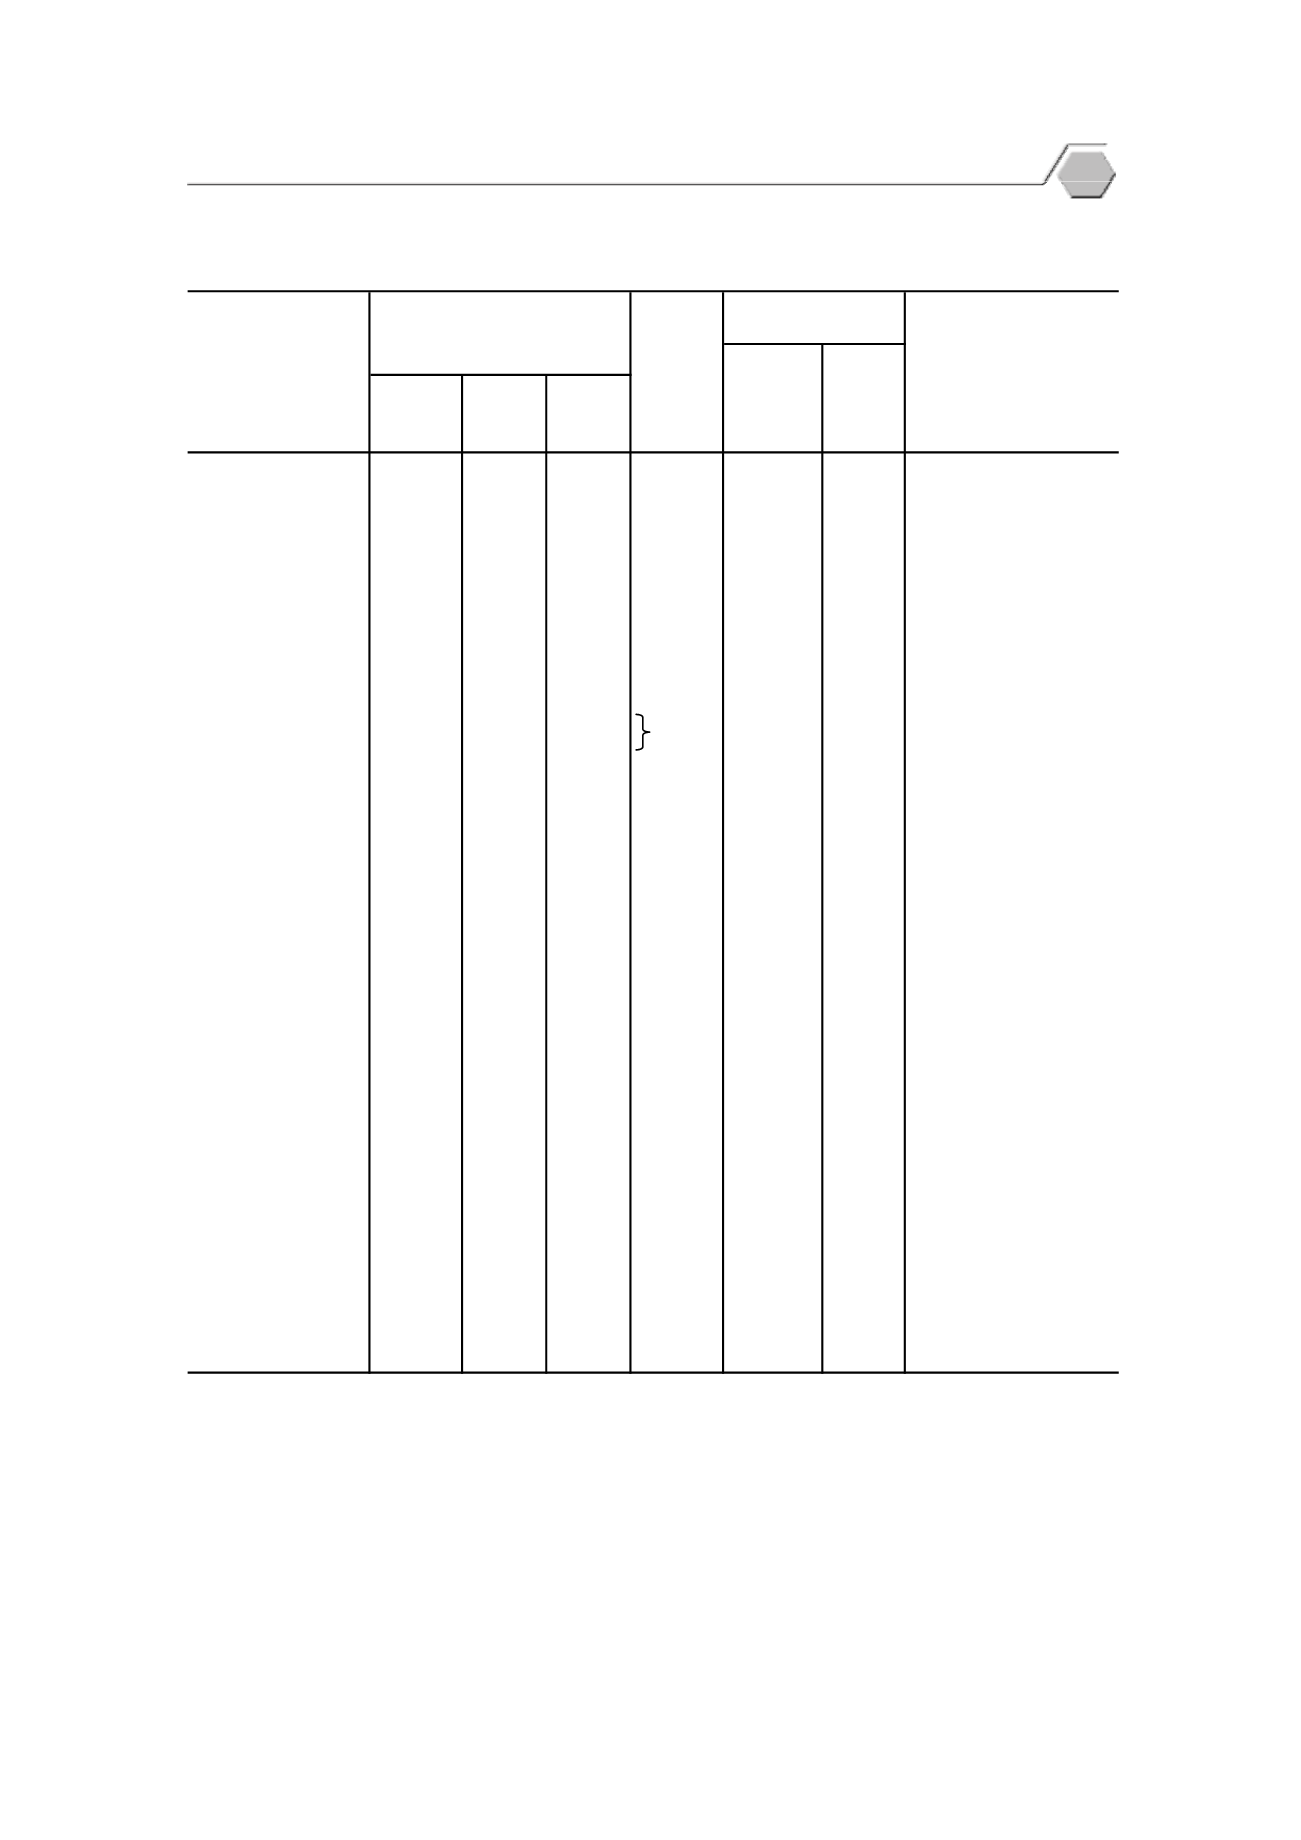
Table
3.1
Students By Level of Education, Grade and Sex: Academic Year
2013
¦³µ¦Ä
ª´
¥Á¦¸
¥
¦ª¤¥°
µ¥
®·
School-age
Total
Male
Female
population
12,975,531
6,416,392
6,559,139
16,246,447
79.87 100.00
n
°¦³¤«¹
µ.......................
1,749,196
901,886
847,310
2,302,089
75.98
13.48 Pre-Elementary Education
°»
µ¨ 1 (®¨´
¼
¦ 3 e
Kindergarten 1
° .)...........................................
246,614
126,648
119,966
750,095
32.88
1.90 (3-yr. Course for private school)
Kindergarten 2
(3-yr. Course for private school)
Kindergarten 1
°»
µ¨ 2 (.)/°»
µ¨ 1............
738,693
381,577
357,116
773,142
95.54
5.69 (2-yr. Course for public school)
Kindergarten 3
(3-yr. Course for private school)
Kindergarten 2
°»
µ¨ 3 (.)/°»
µ¨ 2............
757,973
390,553
367,420
97.32
5.84 (2-yr. Course for public school)
ÁÈ
Á¨È
...............................................
5,916
3,108
2,808
0.76
0.05 Pre-primary
¦³¤«¹
µ.............................. 4,905,460
2,533,424
2,372,036
4,775,667
102.72
37.81 Elementary Education
¦³¤«¹
µe
¸É
1...........................
843,248
439,247
404,001
796,486
105.87
6.50 Grade 1
¦³¤«¹
µe
¸É
2...........................
822,533
425,347
397,186
789,478
104.19
6.34 Grade 2
¦³¤«¹
µe
¸É
3...........................
826,789
425,954
400,835
800,382
103.30
6.37 Grade 3
¦³¤«¹
µe
¸É
4...........................
806,419
416,336
390,083
810,165
99.54
6.21 Grade 4
¦³¤«¹
µe
¸É
5...........................
809,768
417,578
392,190
787,541
102.82
6.24 Grade 5
¦³¤«¹
µe
¸É
6...........................
796,703
408,962
387,741
791,615
100.64
6.14 Grade 6
¤´
¥¤«¹
¬µ°o
...................
2,391,390
1,216,112
1,175,278
2,471,730
96.75
18.43 Lower Secondary Education
¤´
¥¤«¹
µe
¸É
1............................
813,304
419,640
393,664
795,011
102.30
6.27 Grade 7
¤´
¥¤«¹
µe
¸É
2............................
795,877
404,450
391,427
839,107
94.85
6.13 Grade 8
¤´
¥¤«¹
µe
¸É
3............................
782,209
392,022
390,187
837,612
93.39
6.03 Grade 9
¤´
¥¤«¹
¬µ°¨µ¥................ 2,144,118
993,610
1,150,508
2,856,123
75.07
16.52 Upper Secondary Education
¤´
¥¤«¹
µe
¸É
4............................
756,917
354,291
402,626
895,513
84.52
5.83 Grade 10
¤´
¥¤«¹
µe
¸É
5............................
699,004
316,981
382,023
969,890
72.07
5.39 Grade 11
¤´
¥¤«¹
µe
¸É
6............................
688,197
322,338
365,859
990,720
69.46
5.30 Grade 12
°»
¤«¹
µ.................................
2,015,124
865,562
1,149,562
15.53 Higher Education
¦·
µ¦¸
¨³ÉÎ
µªn
µhhhh 1,785,367
771,360
1,014,007
3,840,838
46.48
13.76 Undergraduate Degree and Below
°»
¤«¹
µe
¸É
1............................
624,343
273,103
351,240
979,965
63.71
4.81
Higher Ed. 1st yr.
Higher Ed. 2nd yr.-
°»
¤«¹
µe
¸É
2 - 4....................
1,161,024
498,257
662,767
2,860,873
40.58
8.95
Higher Ed. 4th yr.
°»
¤«¹
µ
(4)
..................................
401,455
174,652
226,803
Higher Ed.
(4)
¼
ªn
µ¦·
µ¦¸
..................
229,757
94,202
135,555
Graduate Degree
¦³µ«¸
¥´
¦´
·
...............
5,451
1,917
3,534
Graduate Diploma
¦·
µÃ......................................
197,500
78,852
118,648
Master Degree
¦³µ«¸
¥´
¦´
·
´Ê
¼
.....
1,442
580
862
Higher Graduate Diploma
¦·
µÁ°...................................
25,364
12,853
12,511
Doctorate Degree
(1) ¦o
°¥¨³
°´
Á¦¸
¥n
°¦³µ¦ª´
¥Á¦¸
¥Á·
100% 缃
°µÁ}
µ¦Î
µª°´
¦µÁ
o
µÁ¦¸
¥°¥n
µ®¥µ
In some cases, enrolment is over 100% because's the gross enrolment, the number of students is greater than
the number of school-age population.
(2) ¦o
°¥¨³
°´
Á¦¸
¥ÄÂn
¨³¦³´
n
°´
Á¦¸
¥»
¦³´
´Ê
®¤
Number of students as a percentage of the total students for all levels.
(3) Ťn
¦ª¤¦³´
¼
ªn
µ¦·
µ¦¸
¨³¦·
µ¦¸
n
ª°µ¥»
Á·
21 e
Excluding number of students in the graduate school and undergraduate students aged over 21 years old.
(4) n
ª°µ¥»
¤µªn
µ 21 e
³Å¤n
Î
µÅ·
´
n
ª´
Á¦¸
¥n
°¦³µ¦Än
ª°µ¥»
18-21 e
Student ageing over 21 years old will not be proportionately calculated as student for population ageing 18-21 years old.
¸É
¤µ: Î
µ´
µ¨´
¦³¦ª ¦³¦ª«¹
¬µ·
µ¦
Source: Office of the Permanent Secretary, Ministry of Education
¦ª¤¥°
(3)
...................
Total
(3)
¦³´
µ¦«¹
¬µ/´Ê
Á¦¸
¥
¦o
°¥¨³
°´
Á¦¸
¥
Level of education/grade
Î
µª´
Á¦¸
¥
Percentage of students
Number of students
n
°¦³µ¦
Ī´
¥Á¦¸
¥
n
°´
Á¦¸
¥
´Ê
®¤
778,852
Per school-age
population
(1)
Per total
students
(2)
Education Statistics
25


