Table
8.2
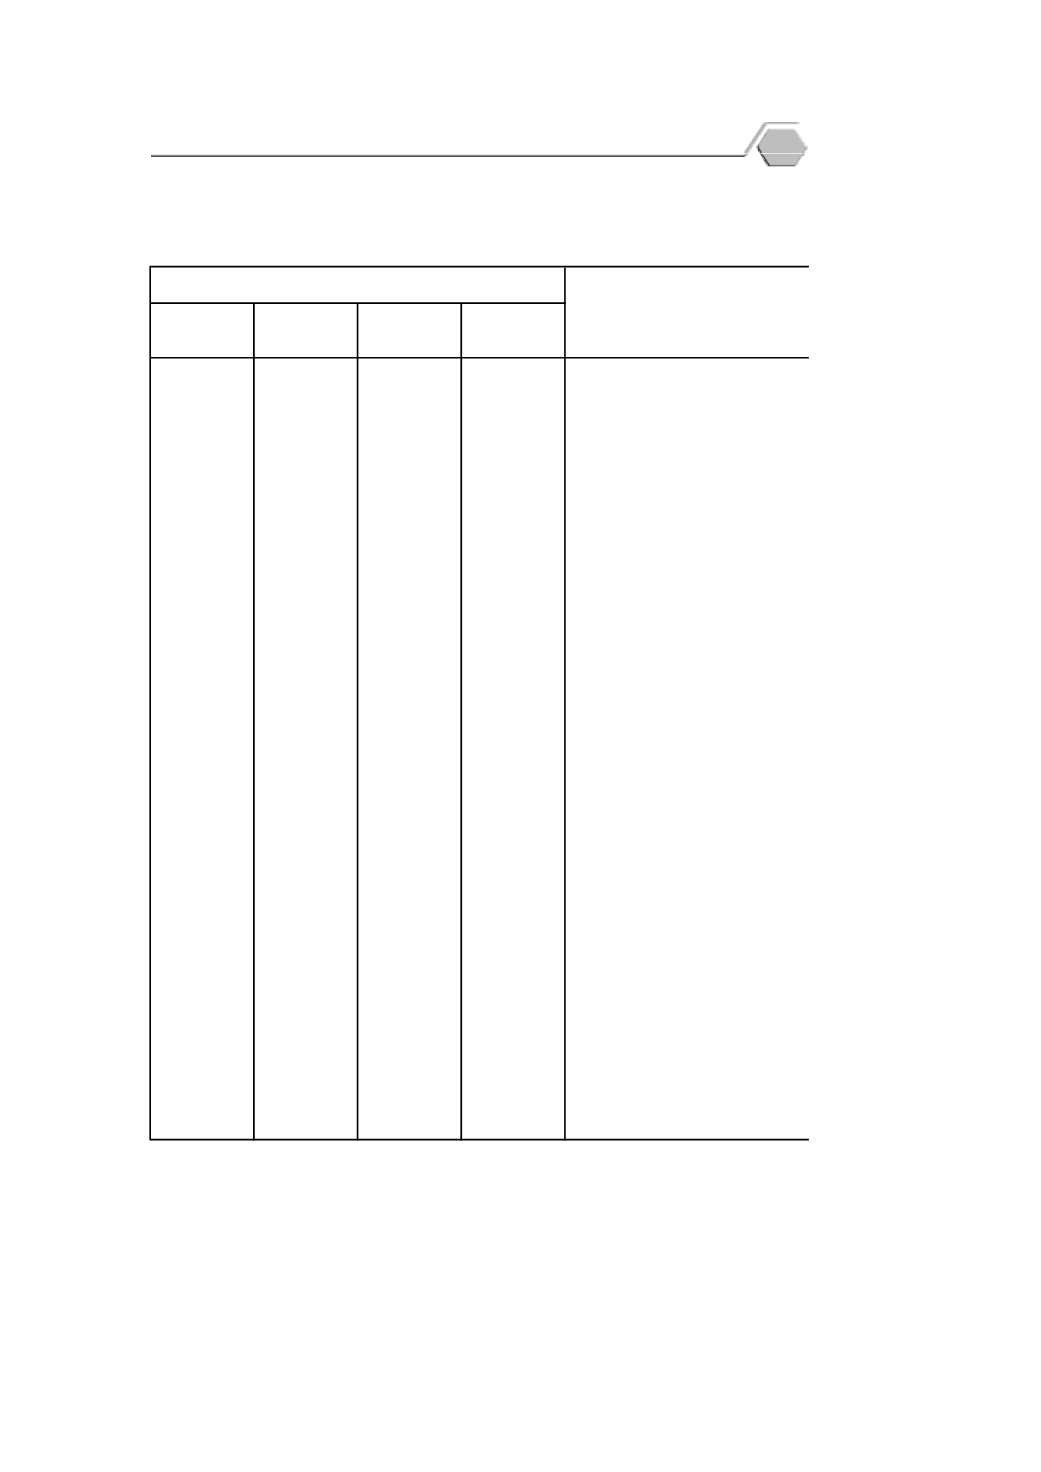
Manufacturing Production Index
: 2015 - 2016
Food
89.8
85.2
78.5
105.7
Canned fruit and vetgetable
79.9
83.4
71.4
84.9
Frozen seafood
Beverages
137.4
117.0
130.5
164.7
Beer
151.2
142.8
138.2
172.6
Soda and drinking water
93.6
111.1
75.8
94.1
Cigarette
Textiles and textile products
86.2
83.3
85.5
89.8
Weaving of textiles
74.0
82.8
63.8
75.3
Garment
144.7
158.9
132.9
142.5
Petroleum products
Construction materials
108.2
103.6
106.5
114.6
Cement
Iron and steel products
118.6
113.0
117.2
125.5
Finished metal plate
115.8
116.8
109.6
121.2
Other shape metal
Vehicles and equipments
138.2
120.4
136.5
157.8
Motor vehicles
115.2
108.9
114.5
122.3
Tyre
Electronic and electrical products
98.5
89.6
96.8
109.1
Electronic components
17.9
21.0
20.3
12.6
Television and radio products
Others
172.1
151.6
171.6
193.1
Air conditioner and compressor
102.3
87.0
98.4
121.6
Pharmaceuticals, Chemicals Products
Source: The Office of Industrial Economics, Ministry of Industry
Item
[2554 (2011) = 100]
2559 (2016)
Value added Weight)
มี
นาคม
March
กุ
มภาพั
นธ
มกราคม
January
ไตรมาสที่
1
Quarter 1
February
Industrial Statistics
55
p


