µ¦µ
3.4
°´
¦µµ¦Á¨ºÉ
°´Ê
.
2
/.
3
.
4
/.
5
¤.
1
/¤.
2
¤.
2
/¤.
3
¤.
4
/¤.
5
¨³ ¤.
5
/¤.
6
e
µ¦«¹
µ
2551 - 2561
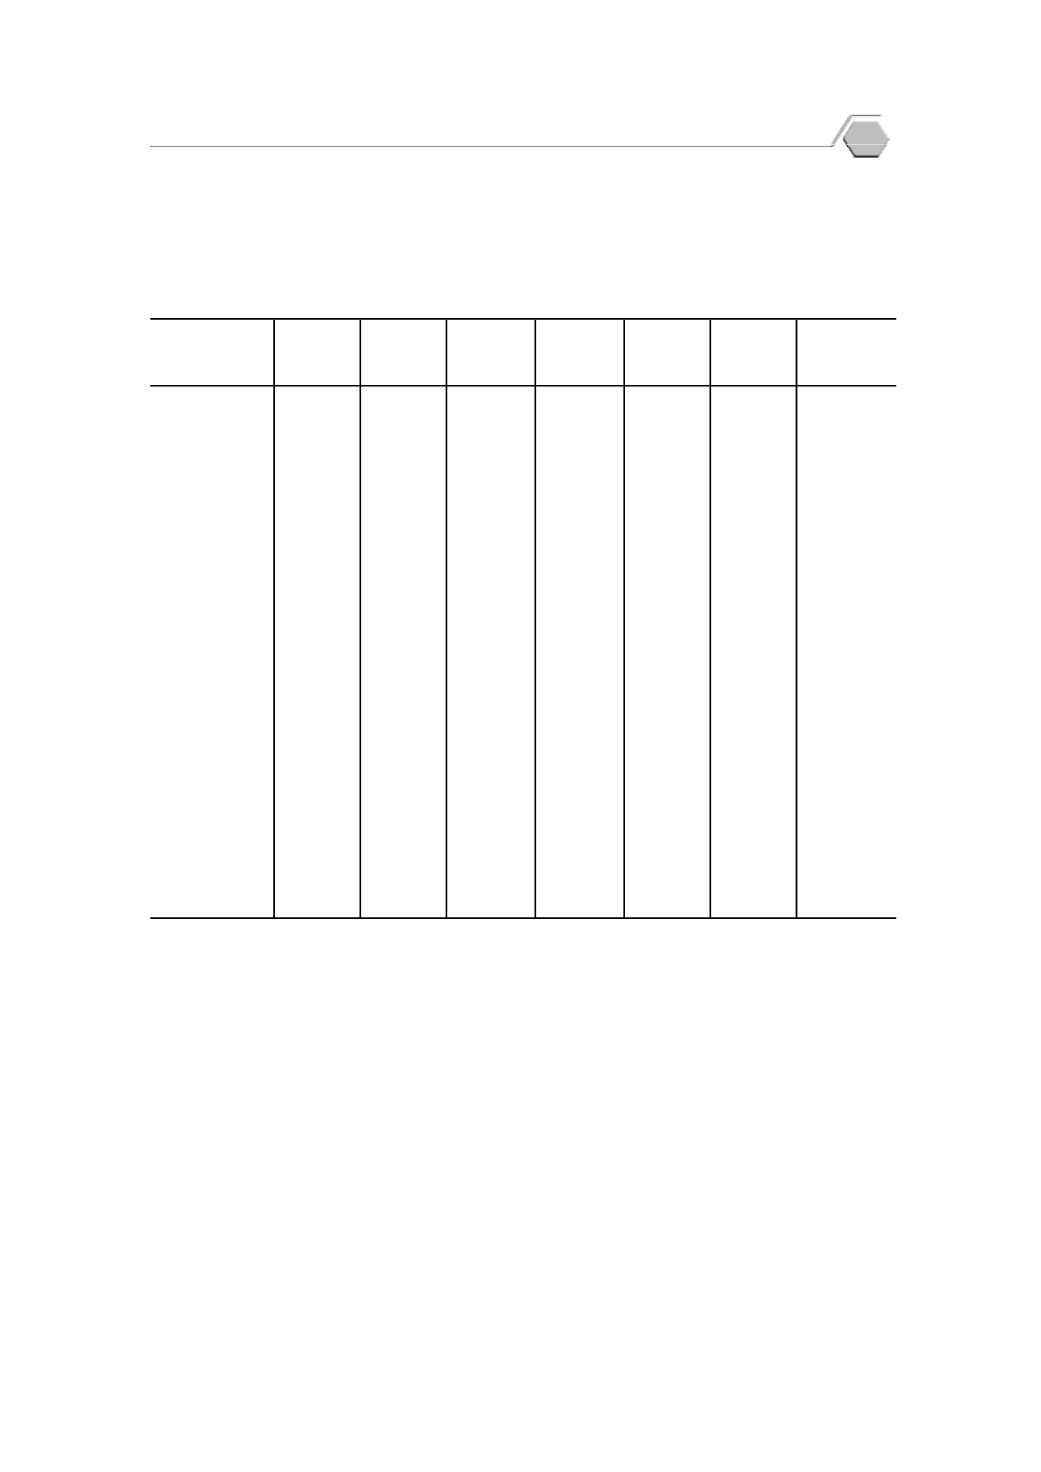
Table
3.4
Gross Promotion Rate
G.2/G.3, G.4/G.5, G.7/G.8,G.8/G.9, G.10/G.1
1 and
G.11/G.12:
Academic Years
2008 - 2018
2551/2552...................
98.19
98.82
95.78
94.82
85.03
94.29
2008/2009
2552/2553...................
100.60
100.98
97.81
97.08
86.79
99.86
2009/2010
2553/2554...................
98.23
98.87
96.35
95.01
85.15
97.08
2010/2011
2554/2555...................
97.06
95.21
86.81
89.63
88.15
99.11
2011/2012
2555/2556...................
99.06
99.60
96.11
96.05
93.20
96.22
2012/2013
2556/2557...................
98.42
99.27
97.69
97.33
95.08
98.08
2013/2014
2557/2558...................
99.30
99.98
97.87
97.02
94.47
97.86
2014/2015
2558/2559...................
98.92
99.60
96.56
96.20
93.37
95.94
2015/2016
2559/2560...................
98.84
99.18
95.78
95.39
93.26
95.62
2016/2017
2560/2561...................
99.31
99.74
96.16
95.51
93.45
96.14
2017/2018
¸É
¤µ: Î
µ´
µ¨´
¦³¦ª ¦³¦ª«¹
¬µ·
µ¦
Source: Office of the Permanent Secretary, Ministry of Education
Academic year
.2/.3
.4/.5
e
µ¦«¹
µ
¤.5/¤.6
G.11/G.12
G.2/G.3
G.4/G.5
¤.2/¤.3
¤.4/¤.5
G.7/G.8
G.8/G.9 G.10/G.11
¤.1/¤.2
41
Education Statistics


