µ¦µ
10.3
¤¼
¨n
µ·
o
µ
µ°°
10
°´
´
¦
°Å¥ Î
µÂÁ}
¦µ¥¦³Á«¸É
Î
µ´
¡.«.
2558 - 2559
Table
10.3
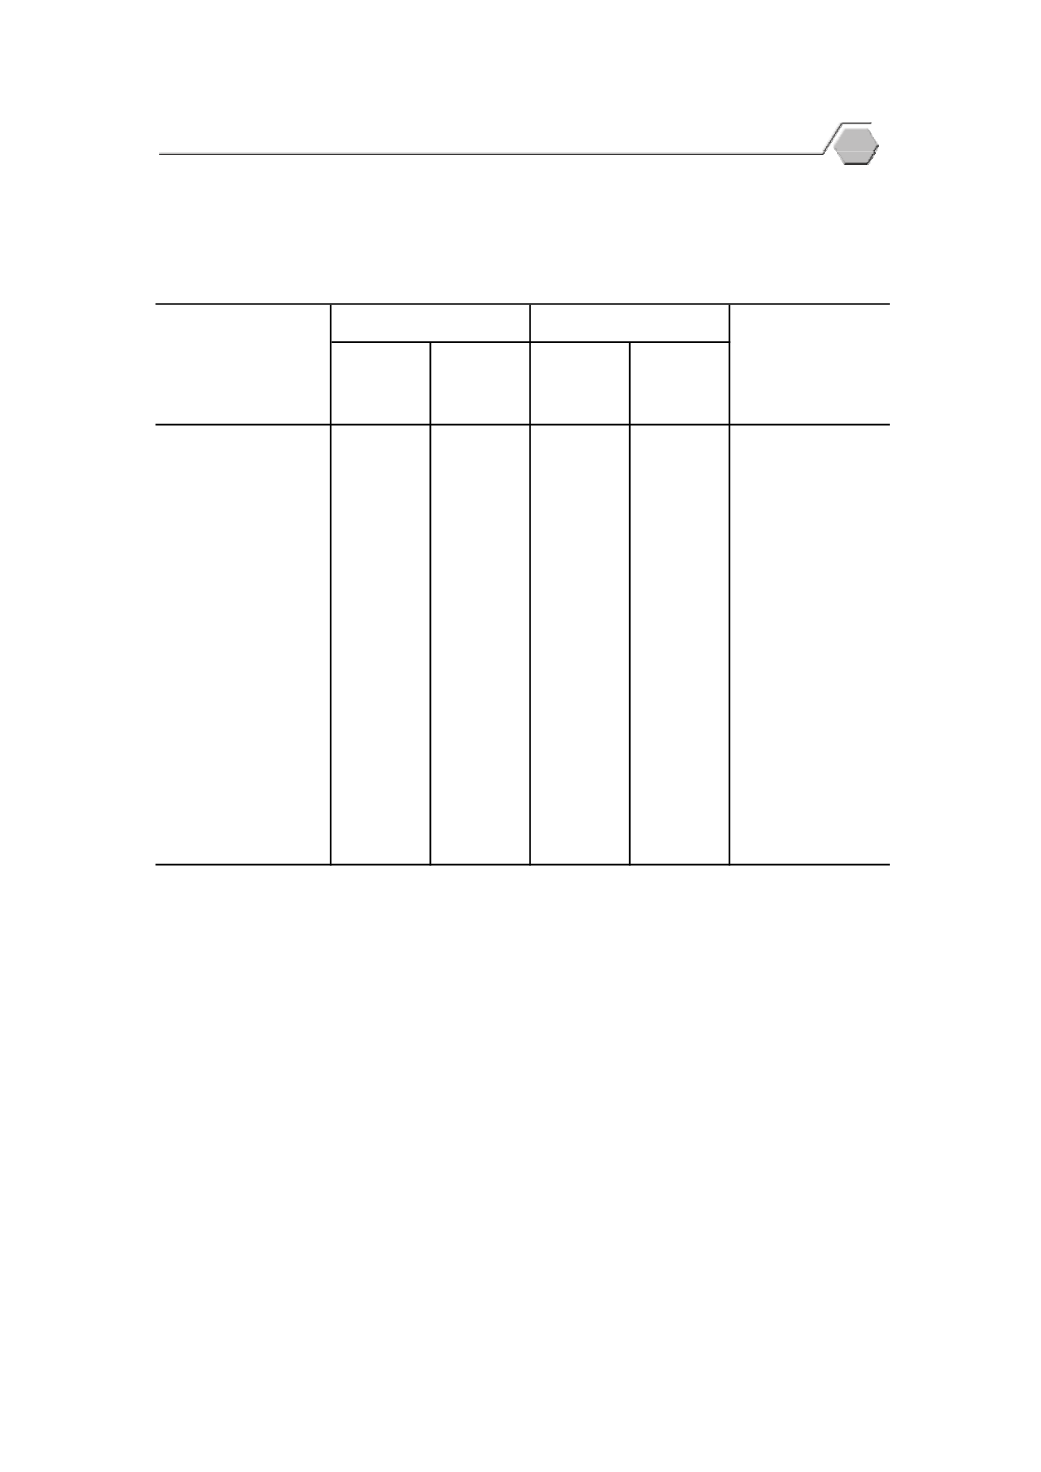
Top Ten Value of Exports of Thailand by Principal Country
: 2015 - 2016
(¨o
µµ
Million Baht
)
Ŧ¤µ¸É
3 Ŧ¤µ¸É
4 Ŧ¤µ¸É
1 Ŧ¤µ¸É
2
Quarter
3
Quarter
4
Quarter
1
Quarter
2
¸
..........................................................
212,341.2
214,918.3
186,820.6
185,291.3
China
®¦´
°Á¤¦·
µ......................................
209,731.2
213,921.1
202,311.5
213,345.4
U.S.A.
¸É
»i
.....................................................
170,925.4
171,694.5
193,707.3
165,289.5
Japan
±n
°..................................................
111,430.1
102,394.4
105,504.7
89,375.5
Hong Kong
°°Á¦Á¨¸
¥..........................................
88,887.8
90,004.1
90,773.1
89,931.5
Australia
Áª¸
¥µ¤..............................................
78,977.9
87,583.9
71,133.2
76,951.9
Vietnam
¤µÁ¨Á¸
¥................................................
87,956.4
83,262.2
89,859.5
80,776.9
Malaysia
°·
ø
Á¸
¥............................................
64,481.2
66,838.9
79,313.4
65,832.8
Indonesia
·
ær
................................................
76,816.0
62,594.5
88,849.1
61,244.5
Singapore
¢d
¨·
d
r
..............................................
51,124.1
62,557.2
58,846.5
52,119.3
Philippines
®¤µ¥Á®»
: Á¦¸
¥¨Î
µ´
µ¤¤¼
¨n
µ·
o
µ
µ°° 10 ¦³Á«Â¦
° ¡.«. 2558
Note
:
Top ten value of Thailand's exported from various countries presented in order of magnitude in
2015.
¸É
¤µ: Î
µ´
µ¨´
¦³¦ª¡µ·
¥r
¦³¦ª¡µ·
¥r
Source
:
Office of the Permanent Secretary, Ministry of Commerce
¦³Á«
Country
2558 (2015)
2559 (2016)
65
Trade and Price Statistics
r
r
r
p


