63,365
50,477
21,940
15,189
1,841 614
104
40
572
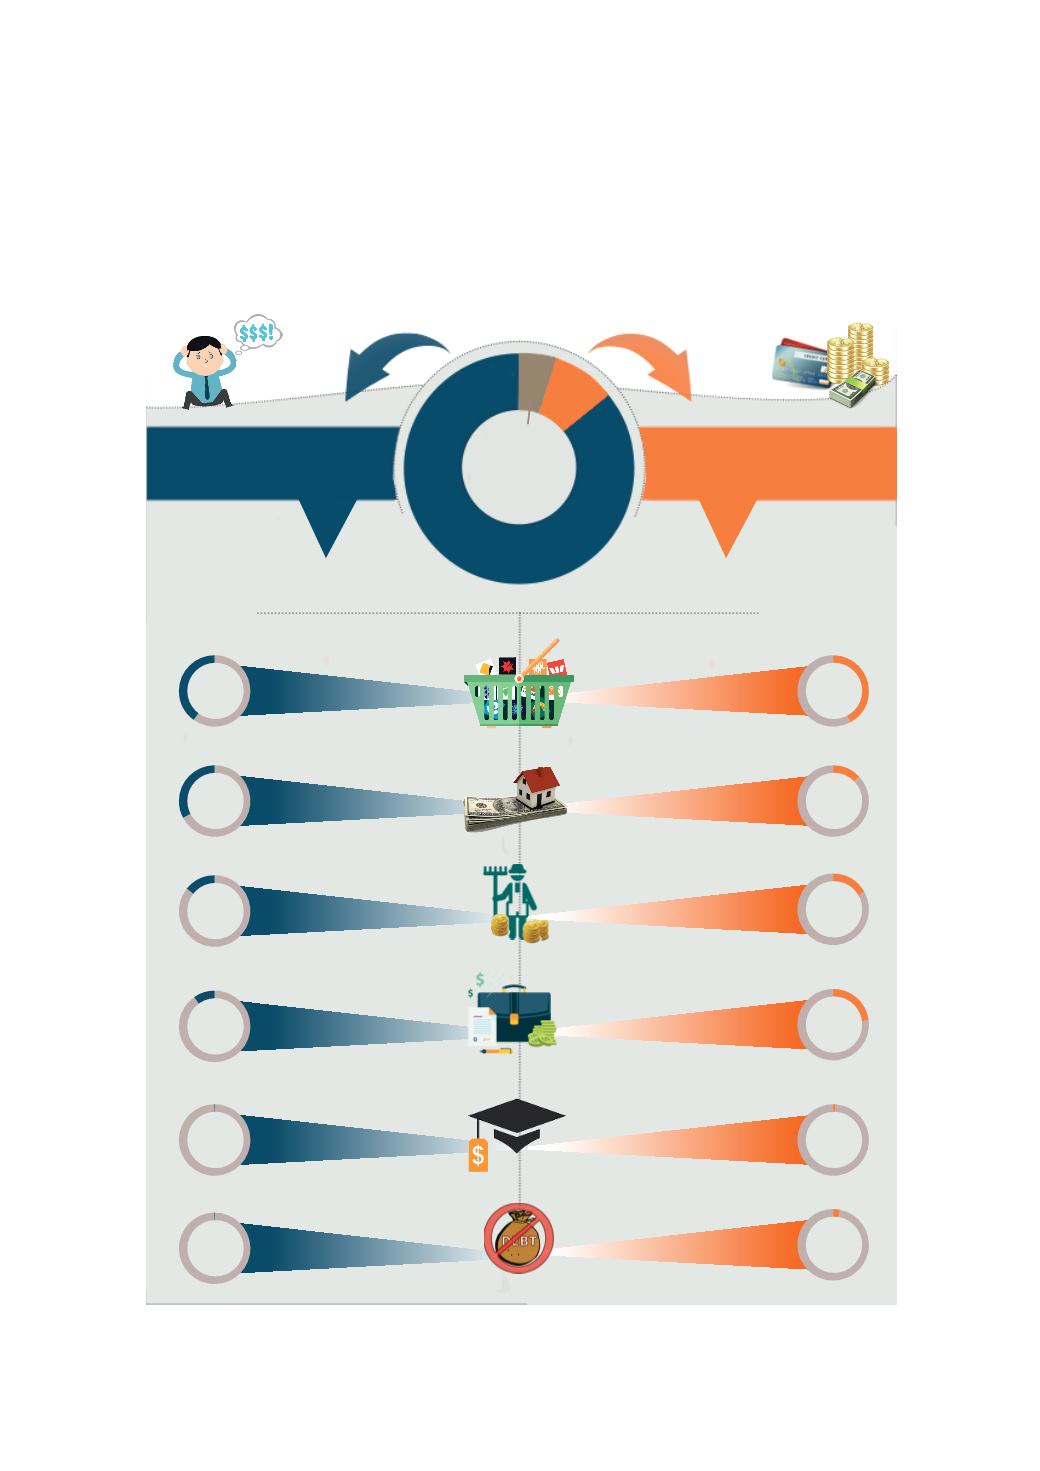
แผนภู
มิ
3
ร
อยละของครั
วเรื
อนที่
มี
หนี้
สิ
นในระบบและนอกระบบ และจำนวนหนี้
สิ
นเฉลี่
ยต
อครั
วเรื
อน พ.ศ.2558
Figure
3
Percentage of Indebted Households and Average Amount of Debt
per All Households by Type of Debt : 2015
ที่
มา: สำนั
กงานสถิ
ติ
แห
งชาติ
Source: National Statistical Office
91.4 %
หนี้
สิ
นในระบบเฉลี่
ย
by Purpose of Borrowing
153,425
หนี้
สิ
นนอกระบบเฉลี่
ย
Average Amount of Informal Loan
(Baht/Household)
Average Amount of Formal Loan
(Baht/Household)
ใช
ในการศึ
กษา (Education)
(บาท/ครั
วเรื
อน)
(บาท/ครั
วเรื
อน)
หนี้
สิ
นทั้
งในและ
นอกระบบ
(Both Formal and
Informal Loans)
3,346
4.9 %
3.7 %
ใช
ทำการเกษตร (Farming)
ซื้
อ/เช
าซื้
อบ
าน และ/หรื
อที่
ดิ
น (Purchase/Hire Purchase of House and/or Land)
หนี้
อื่
นๆ (Others)
ใช
ทำธุ
รกิ
จ (Business)
41.3 %
32.9 %
14.3 %
9.9 %
0.4 %
1.2 %
42.2 %
13.2 %
17.1 %
23.2 %
1.2 %
3.1 %
จำแนกตามวั
ตถุ
ประสงค
ของการกู
ยื
ม
ใช
อุ
ปโภค/บริ
โภค (Household Consumption Expenditure)


