µ¦µ
3.1
´
Á¦¸
¥ ·
·
´
«¹
¬µ Î
µÂµ¤¦³´
µ¦«¹
¬µ ´Ê
Á¦¸
¥ ¨³Á¡« e
µ¦«¹
µ
2557
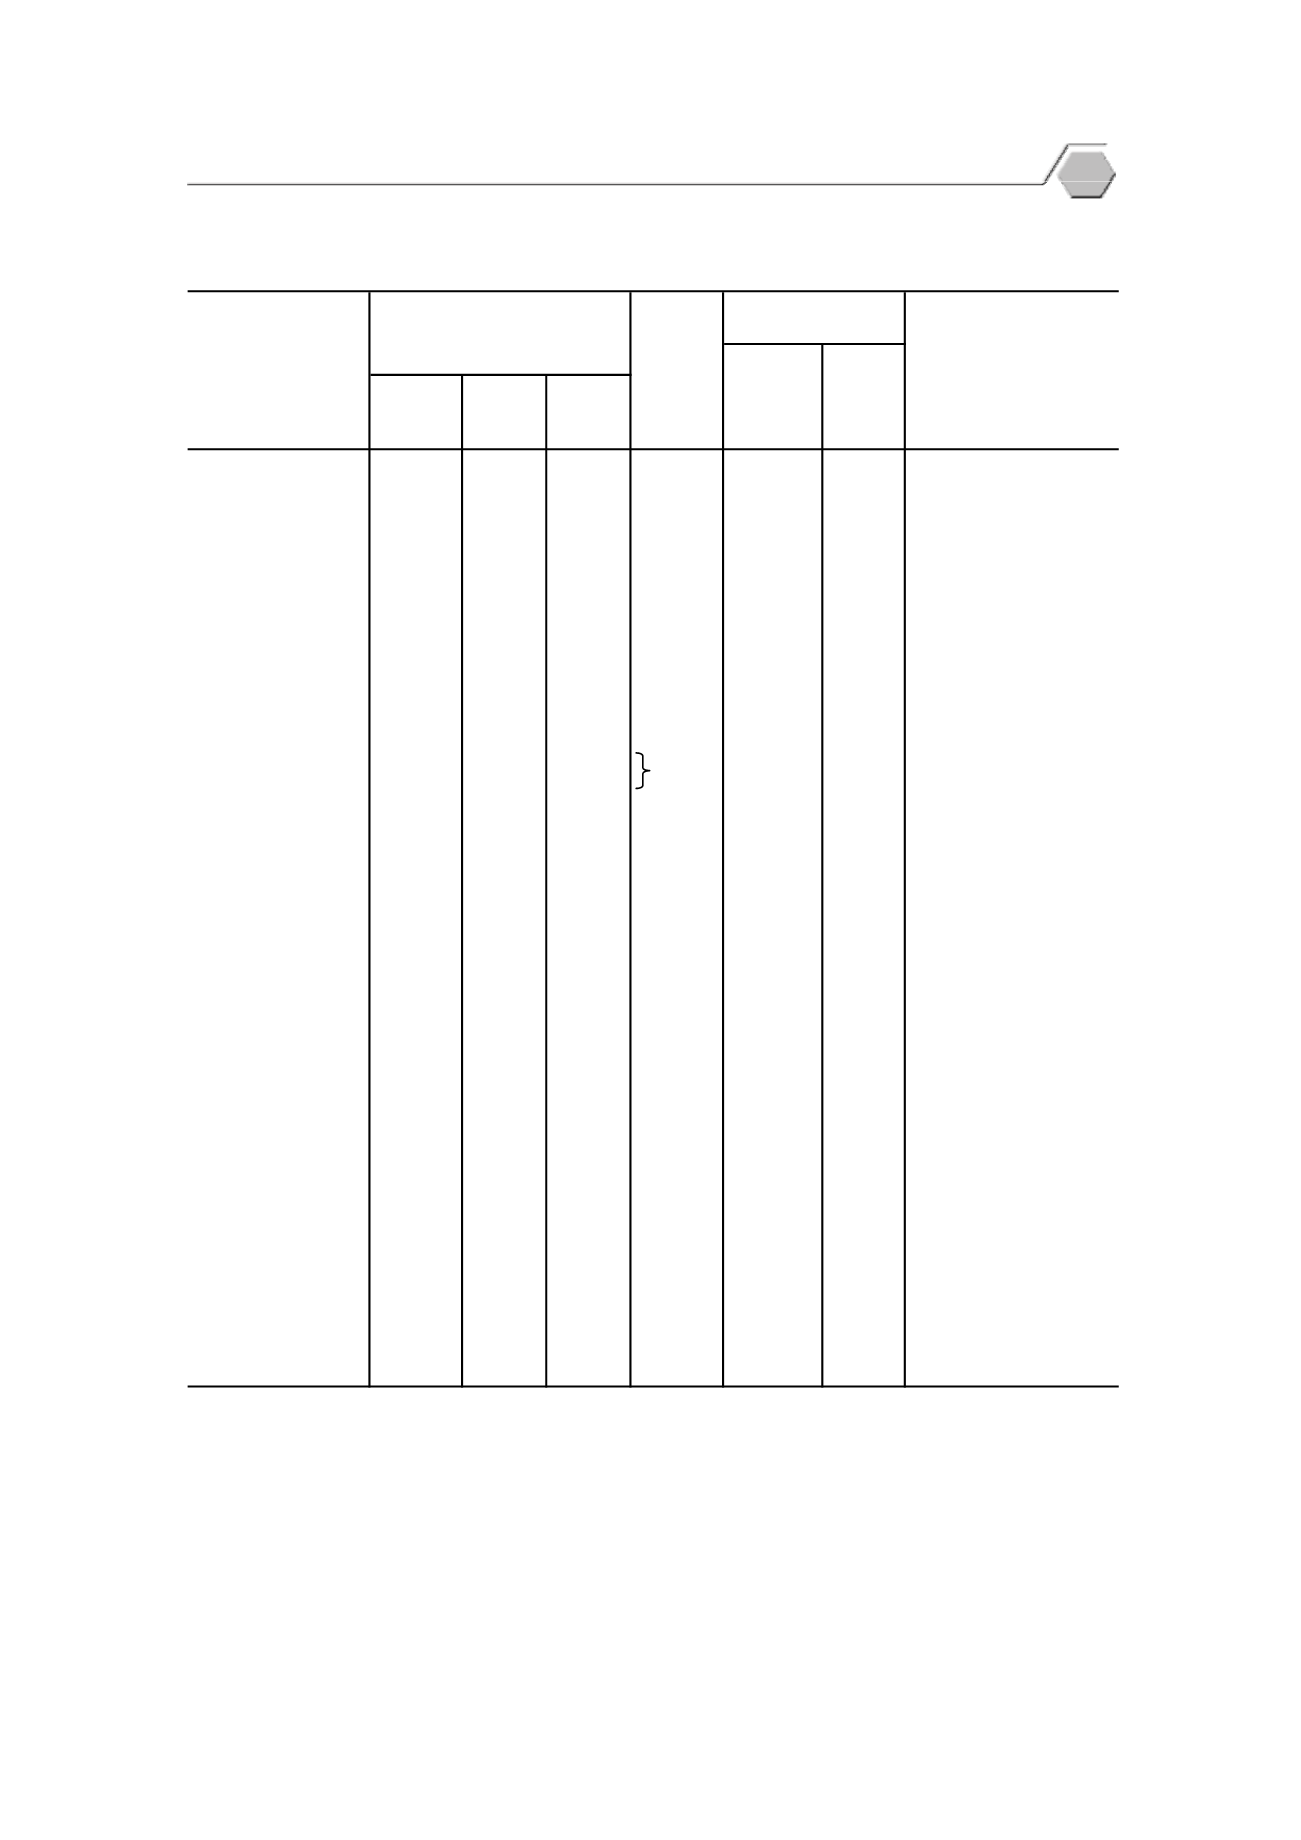
Table
3.1
Student By Level of Education, Grade and Sex: Academic Year
2014
¦³µ¦Ä
ª´
¥Á¦¸
¥
¦ª¤¥°
µ¥
®·
School-age
Total
Male
Female
population
12,776,168
6,514,833
6,261,335
16,050,260
79.60 100.00
n
°¦³¤«¹
µ.......................
1,678,415
919,136
759,279
2,301,354
72.93
13.14 Pre-Elementary Education
Pre-kindergarten
Á¦¸
¥¤°»
µ¨
14,223
7,454
6,769
1,522,482
0.93
0.11 (Course for private school)
°»
µ¨ 1 (®¨´
¼
¦ 3 e
Kindergarten 1
° .)...........................................
215,646
112,892
102,754
776,040
27.79
1.69 (3-yr. Course for private school)
Kindergarten 2
(3-yr. Course for private school)
Kindergarten 1
°»
µ¨ 2 (.)/°»
µ¨ 1............
722,595
396,544
326,051
751,486
96.16
5.66 (2-yr. Course for public school)
Kindergarten 3
(3-yr. Course for private school)
Kindergarten 2
°»
µ¨ 3 (.)/°»
µ¨ 2............
733,687
406,365
327,322
94.81
5.74 (2-yr. Course for public school)
ÁÈ
Á¨È
...............................................
6,487
3,335
3,152
0.84
0.05 Pre-primary
¦³¤«¹
µ.............................. 4,870,578
2,597,886
2,272,692
4,763,918
102.24
38.12 Elementary Education
¦³¤«¹
µe
¸É
1...........................
830,067
444,208
385,859
779,101
106.54
6.50 Grade 1
¦³¤«¹
µe
¸É
2...........................
812,239
436,296
375,943
796,740
101.95
6.36 Grade 2
¦³¤«¹
µe
¸É
3...........................
809,570
432,985
376,585
789,717
102.51
6.34 Grade 3
¦³¤«¹
µe
¸É
4...........................
819,462
435,926
383,536
800,465
102.37
6.41 Grade 4
¦³¤«¹
µe
¸É
5...........................
800,551
425,992
374,559
810,286
98.80
6.27 Grade 5
¦³¤«¹
µe
¸É
6...........................
798,689
422,479
376,210
787,609
101.41
6.25 Grade 6
¤´
¥¤«¹
¬µ°o
...................
2,356,200
1,224,121
1,132,079
2,425,716
97.13
18.44 Lower Secondary Education
¤´
¥¤«¹
µe
¸É
1............................
787,026
409,497
377,529
791,664
99.41
6.16 Grade 7
¤´
¥¤«¹
µe
¸É
2............................
794,542
414,407
380,135
795,096
99.93
6.22 Grade 8
¤´
¥¤«¹
µe
¸É
3............................
774,632
400,217
374,415
838,956
92.33
6.06 Grade 9
¤´
¥¤«¹
¬µ°¨µ¥................ 2,088,027
1,006,026
1,082,001
2,701,701
77.29
16.34 Upper Secondary Education
¤´
¥¤«¹
µe
¸É
4............................
692,228
329,821
362,407
837,372
82.67
5.42 Grade 10
¤´
¥¤«¹
µe
¸É
5............................
684,268
324,815
359,453
895,138
76.44
5.36 Grade 11
¤´
¥¤«¹
µe
¸É
6............................
711,531
351,390
360,141
969,191
73.41
5.57 Grade 12
°»
¤«¹
µ.................................
1,998,150
852,504
1,145,646
15.64 Higher Education
¦·
µ¦¸
¨³ÉÎ
µªn
µhhhh 1,782,948
767,664
1,015,284
3,857,571
46.22
13.96 Undergraduate Degree and Below
°»
¤«¹
µe
¸É
1............................
651,557
287,418
364,139
989,446
65.85
5.10
Higher Ed. 1st yr.
Higher Ed. 2nd yr.-
°»
¤«¹
µe
¸É
2 - 4....................
1,131,391
480,246
651,145
2,868,125
39.45
8.86
Higher Ed. 4th yr.
°»
¤«¹
µ
(4)
..................................
356,920
153,986
202,934
Higher Ed.
(4)
¼
ªn
µ¦·
µ¦¸
..................
215,202
84,840
130,362
Graduate Degree
¦³µ«¸
¥´
¦´
·
...............
4,156
1,775
2,381
Graduate Diploma
¦·
µÃ......................................
184,180
69,904
114,276
Master Degree
¦³µ«¸
¥´
¦´
·
´Ê
¼
.....
1,525
584
941
Higher Graduate Diploma
¦·
µÁ°...................................
25,341
12,577
12,764
Doctorate Degree
(1) ¦o
°¥¨³
°´
Á¦¸
¥n
°¦³µ¦ª´
¥Á¦¸
¥Á·
100% 缃
°µÁ}
µ¦Î
µª°´
¦µÁ
o
µÁ¦¸
¥°¥n
µ®¥µ
In some cases, enrolment is over 100% because's the gross enrolment, the number of students is greater than
the number of school-age population.
(2) ¦o
°¥¨³
°´
Á¦¸
¥ÄÂn
¨³¦³´
n
°´
Á¦¸
¥»
¦³´
´Ê
®¤
Number of students as a percentage of the total students for all levels.
(3) Ťn
¦ª¤¦³´
¼
ªn
µ¦·
µ¦¸
¨³¦·
µ¦¸
n
ª°µ¥»
Á·
21 e
Excluding number of students in the graduate school and undergraduate students aged over 21 years old.
(4) n
ª°µ¥»
¤µªn
µ 21 e
³Å¤n
Î
µÅ·
´
n
ª´
Á¦¸
¥n
°¦³µ¦Än
ª°µ¥»
18-21 e
Student ageing over 21 years old will not be proportionately calculated as student for population ageing 18-21 years old.
¸
É
¤µ: Î
µ´
µ¨´
¦³¦ª ¦³¦ª«¹
¬µ·
µ¦
Source: Office of the Permanent Secretary, Ministry of Education
n
°´
Á¦¸
¥
´Ê
®¤
773,828
Per school-age
population
(1)
Per total
students
(2)
¦ª¤¥°
(3)
...................
Total
(3)
¦³´
µ¦«¹
¬µ/´Ê
Á¦¸
¥
¦o
°¥¨³
°´
Á¦¸
¥
Level of education/grade
Î
µª´
Á¦¸
¥
Percentage of students
Number of students
n
°¦³µ¦
Ī´
¥Á¦¸
¥
Education Statistics
25


