µ¦µ
7.1
´
¸
¨¨·
·
o
µÁ¬¦¸É
Î
µ´
(¦´
§¼
µ¨) Î
µÂµ¤·
¡º
¡.«.
2558 - 2559
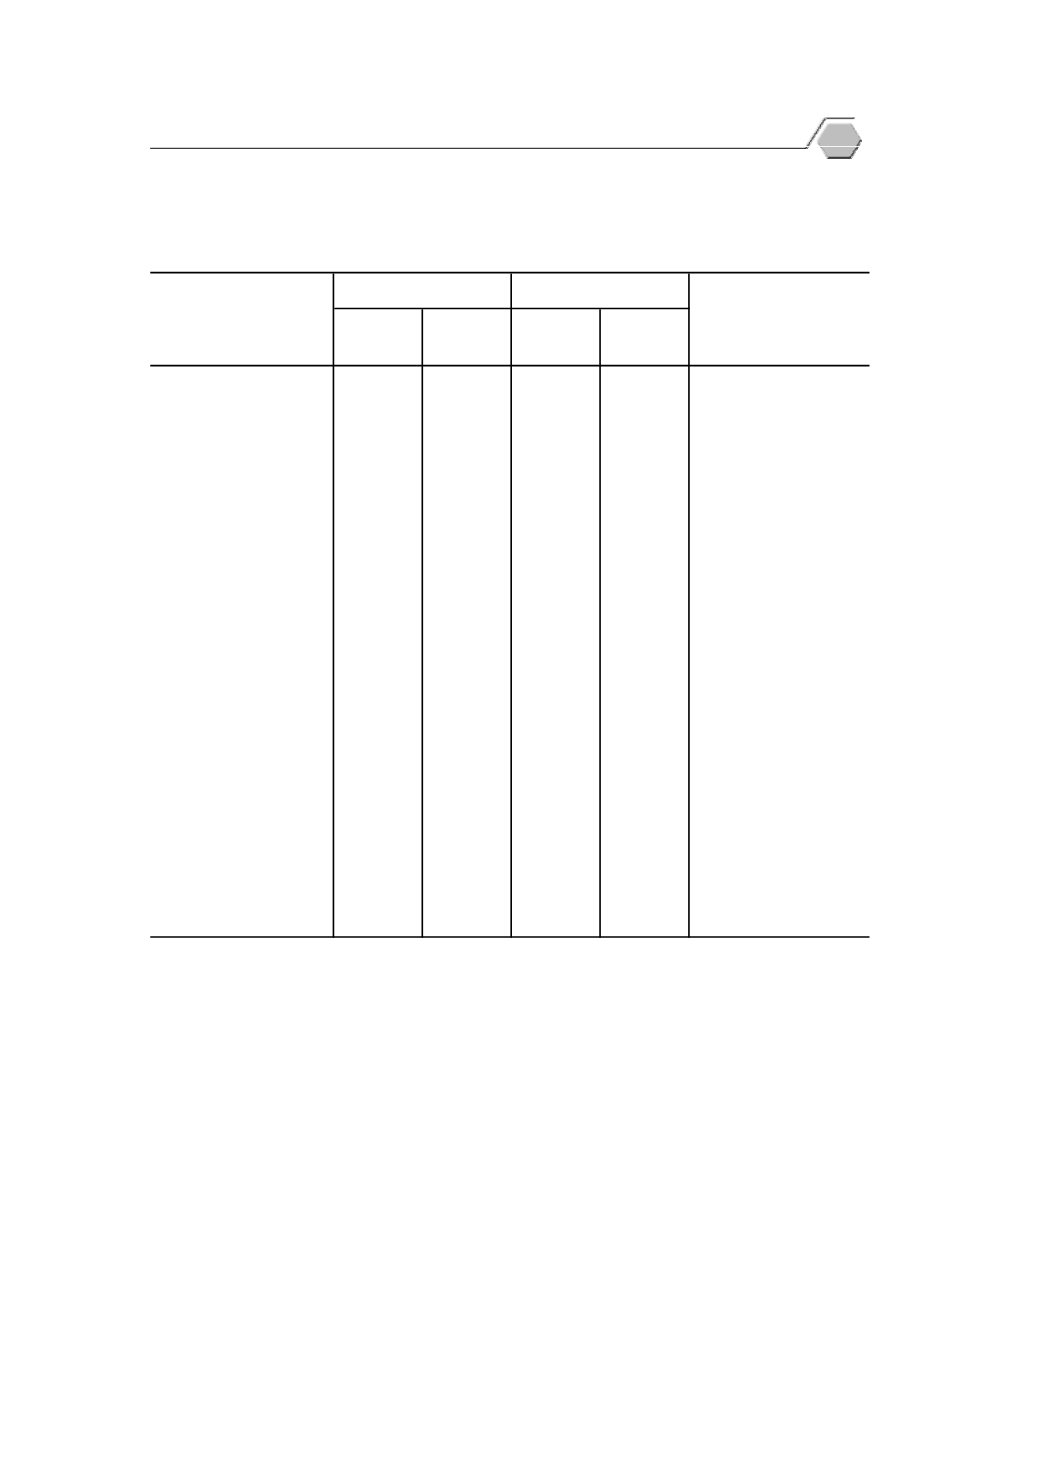
Table
7.1
Agricultural Production Index (Seasonally Adjusted) by Type of Crops
: 2015 - 2016
[2548 (2005) = 100]
o
µªÁ¨º
°.........................................
52.06
114.42
77.12
51.53
Paddy
o
µªÃ¡Á¨¸Ê
¥´
ªr
hhhhhhhhhhh 101.34
116.06
104.50
87.48
Maize
´
³¦Ã¦µ....................h........
84.25
93.12
78.36
69.33
Pineapple
´É
ªÁ
¸
¥ª..............................................
83.81
83.96
82.78
79.58
Mung bean
¥µÂn
·
´Ê
3...............................
152.91
149.68
147.69
141.93
Rubber, un-smoked sheet
3
´É
ªÁ®¨º
°¨³....................................
29.74
29.20
24.25
25.29
Soybean
´É
ª¨·
...............................................
55.13
55.28
55.98
54.40
Groundnut
¨o
ª¥®°¤°
µ¨³...............
50.24
50.00
53.47
53.02
Banana, Cavendish
°o
°¥¦ª¤¡´
»r
...............................h..
241.81
236.29
217.06
200.77
Sugar cane
»
Á¦¸
¥®¤°°.............................
107.43
35.13
127.94
73.32
Durians
¤´
Î
µ³®¨´
¨³..............................
143.63
134.43
158.19
366.64
Cassava
®°¤Â®o
Įn
¨³.....................
60.90
12.01
56.82
48.27
Shallot
¤³¡¦o
µªÂ®o
Įn
.............................
47.39
46.52
47.28
47.11
Coconuts
¤´
¦´É
...............................................
117.77
116.67
164.05
116.60
Potato
¸É
¤µ: Î
µ´
µÁ«¦¬·
µ¦Á¬¦ ¦³¦ªÁ¬¦Â¨³®¦r
Source
:
Office of Agricultural Economics, Ministry of Agriculture and Cooperatives
Quarter
3
Quarter
4
Quarter
1
Quarter
2
Ŧ¤µ¸É
3 Ŧ¤µ¸É
4 Ŧ¤µ¸É
1 Ŧ¤µ¸É
2
Crops
·
¡º
2559 (2016)
2558 (2015)
r
p
Agriculture and Fishery Statistics
49


