ลงทุ
นรวม
การส่
งออก
สาขาอุ
ตสาหกรรม
สาขาขนส่
ง
ผลิ
ตภั
ณฑ์
มวลรวมในประเทศ (GDP)
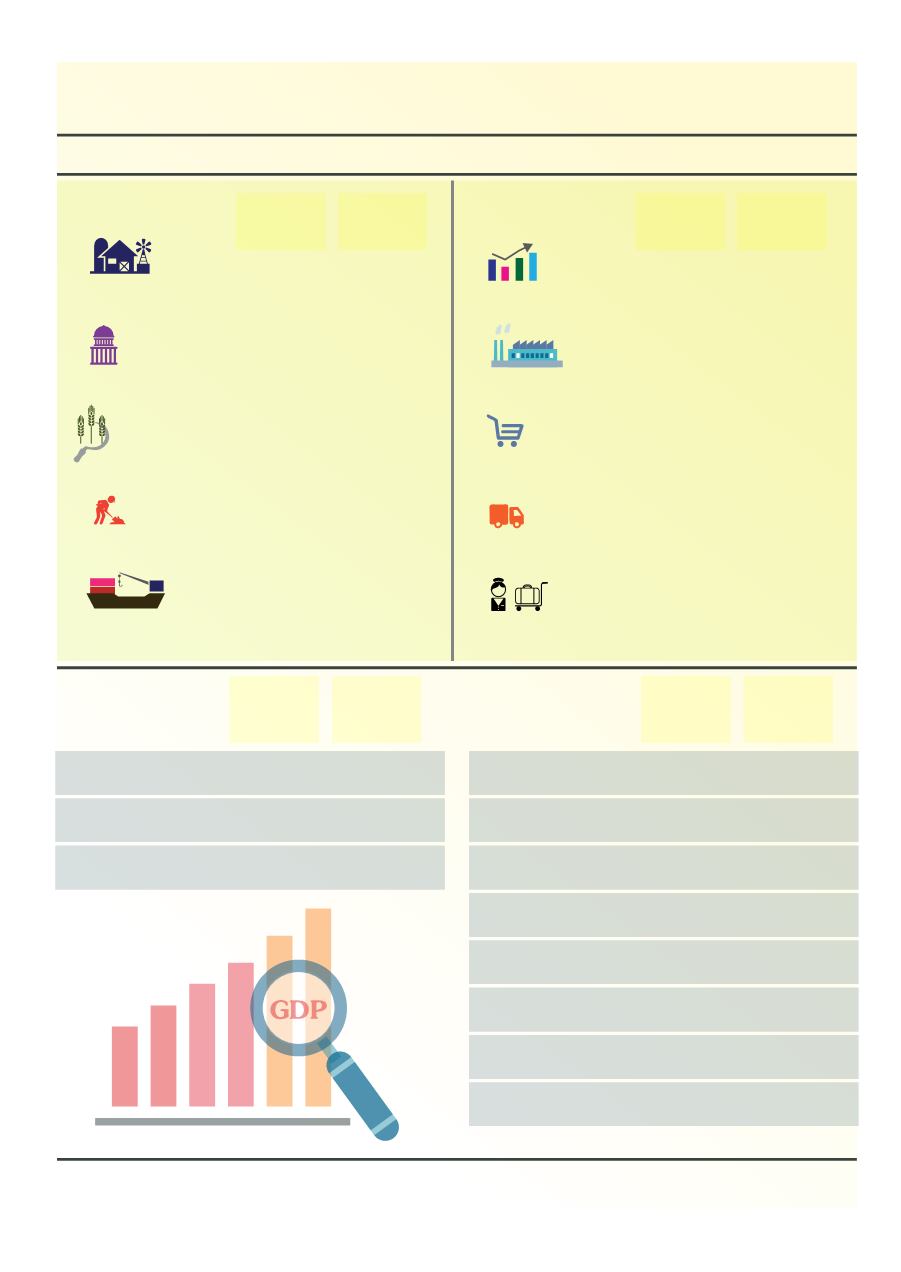
แผนภู
มิ
3 อั
ตราการขยายตั
วผลิ
ตภั
ณฑ์
มวลรวมในประเทศ ไตรมาส 1 พ.ศ. 2559-2560
Figure 3 Growth Rate Gross Domestic Product Quarter 1 : 2016-2017
2559
2016
2.8
9.1
3.2
0.2
2560
2017
-2.0
11.9
7.7
2.8
4.8
2.7
2559
2016
5.0
-0.2
1.7
1.2
2560
2017
6.4
6.4
5.9
5.9
12.3
5.3
รายจ่
ายรั
ฐบาล
รายจ่
ายครั
วเรื
อน
Private Final Consumption Expenditure
General Government Final Consumption Expenditure
Agriculture
Construction
Export
ที่
มา : สำนั
กงานคณะกรรมการพั
ฒนาการเศรษฐกิ
จและสั
งคมแห่
งชาติ
Source : Office of the National Economic and Social Department Board
Gross Fixed Capital Formation
Manufacturing
Trade
Transport
Hotels and Restaurants
ภาคเกษตร
สาขาก่
อสร้
าง
สาขาการค้
า
ด้
านการผลิ
ต
Production
2559
2016
-2.0
3.7
3.1
2.9
3.3
2560
2017
ภาคนอกเกษตร
Non-Agriculture
GDP
ภาคเกษตร
Agriculture
7.7
Expenditure
รายจ่
ายครั
วเรื
อน
Private
ภาครั
ฐบาล
Public
การลงทุ
นรวม
Gross Fixed Capital Formation
ภาคเอกชน
Private
ภาครั
ฐ
Public
การส่
งออก
Exports
การนำเข้
า
Imports
GDP
2559
2016
2.8
9.1
3.2
0.2
2560
2017
5.0
2.4
1.7
-1.1
12.9
9.7
4.8
2.7
-5.2
6.0
3.1
3.3
ด้
านการใช้
จ่
าย
สาขาโรงแรมและภั
ตตาคาร
ผลิ
ตภั
ณฑ์
มวลรวมในประเทศ
ผลิ
ตภั
ณฑ์
มวลรวมในประเทศ


