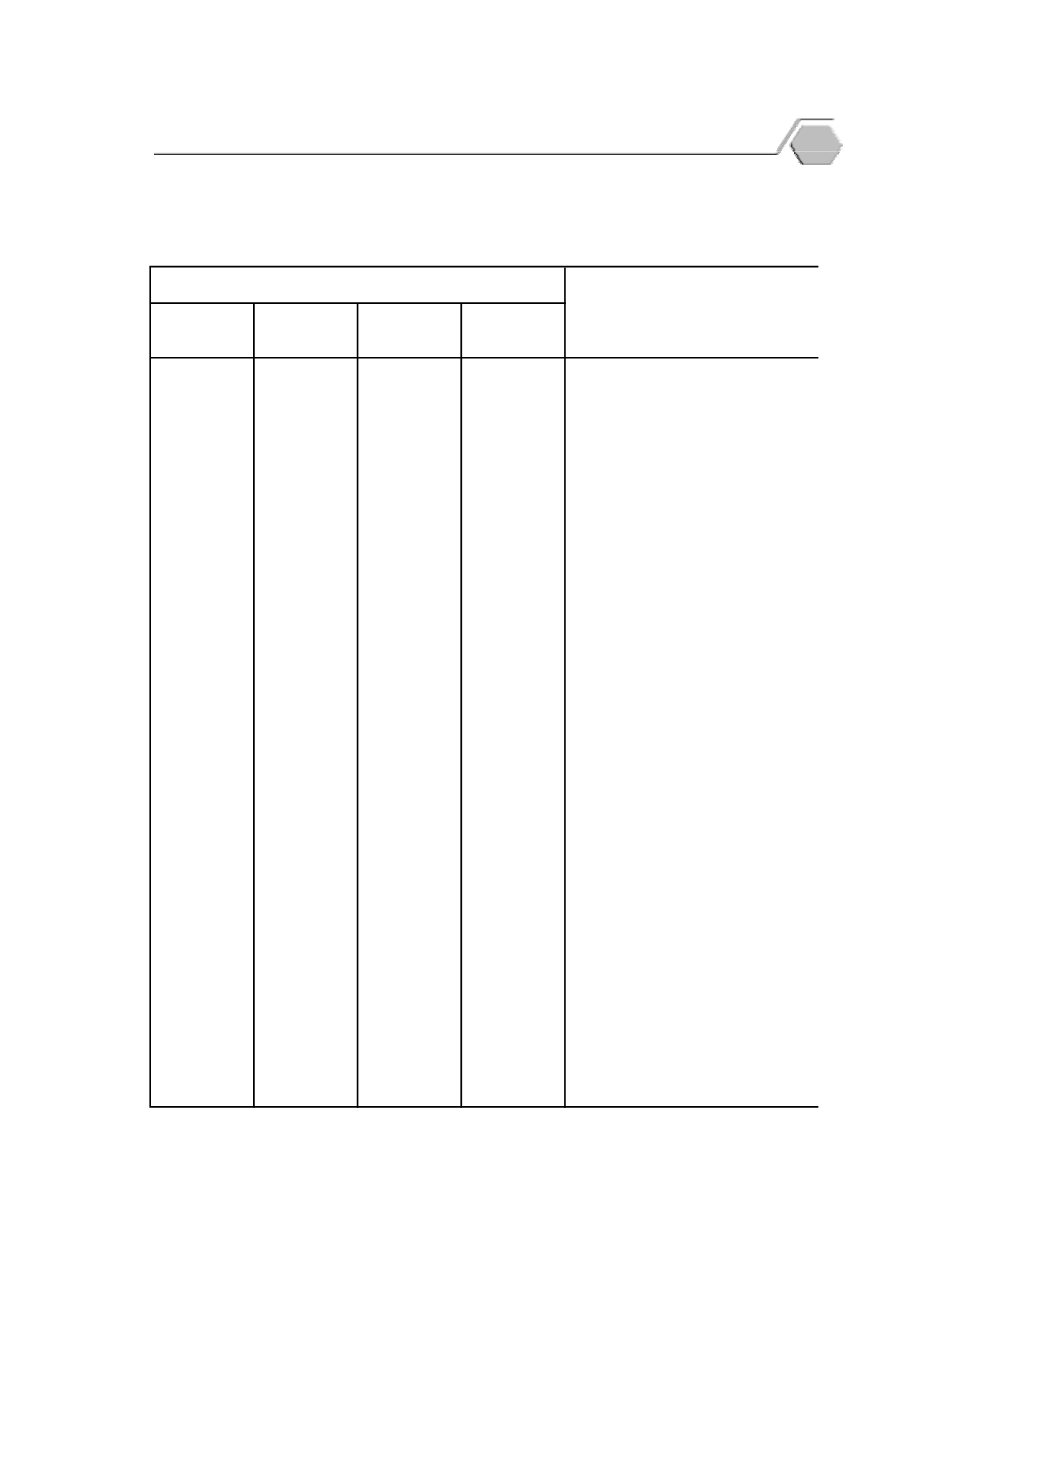
Table
8.2
Manufacturing Production Index
: 2017
Food
82.8
72.7
88.4
87.2
Canned fruit and vetgetable
88.1
77.6
92.1
94.6
Frozen seafood
Beverages
116.1
123.5
116.2
108.5
Beer
142.1
154.7
149.2
122.3
Soda and drinking water
77.3
71.0
81.4
79.6
Cigarette
Textiles and textile products
77.3
68.0
83.4
80.4
Weaving of textiles
85.6
69.9
96.2
90.7
Garment
164.8
166.7
161.8
165.7
Petroleum products
Construction materials
94.0
98.2
93.0
90.9
Cement
Iron and steel products
122.8
132.9
124.3
111.3
Finished metal plate
115.5
107.7
115.9
122.9
Other shape metal
Vehicles and equipments
129.4
101.3
144.3
142.6
Motor vehicles
112.6
96.2
121.8
119.9
Tyre
Radio, Television and Communication
112.6
106.2
114.8
116.7
Equipment and Apparatus
Others
170.1
175.4
192.8
142.1
Air conditioner and compressor
149.0
137.2
152.8
156.9
Pharmaceuticals, Chemicals Products
Source: The Office of Industrial Economics, Ministry of Industry
Item
ไตรมาสที่
2
Quarter
2
เมษายน
April
[2554 (2011) = 100]
2560 (2017)
Value added Weight)
มิ
ถุ
นายน
June
พฤษภาคม
May
Industrial Statistics
55
p


