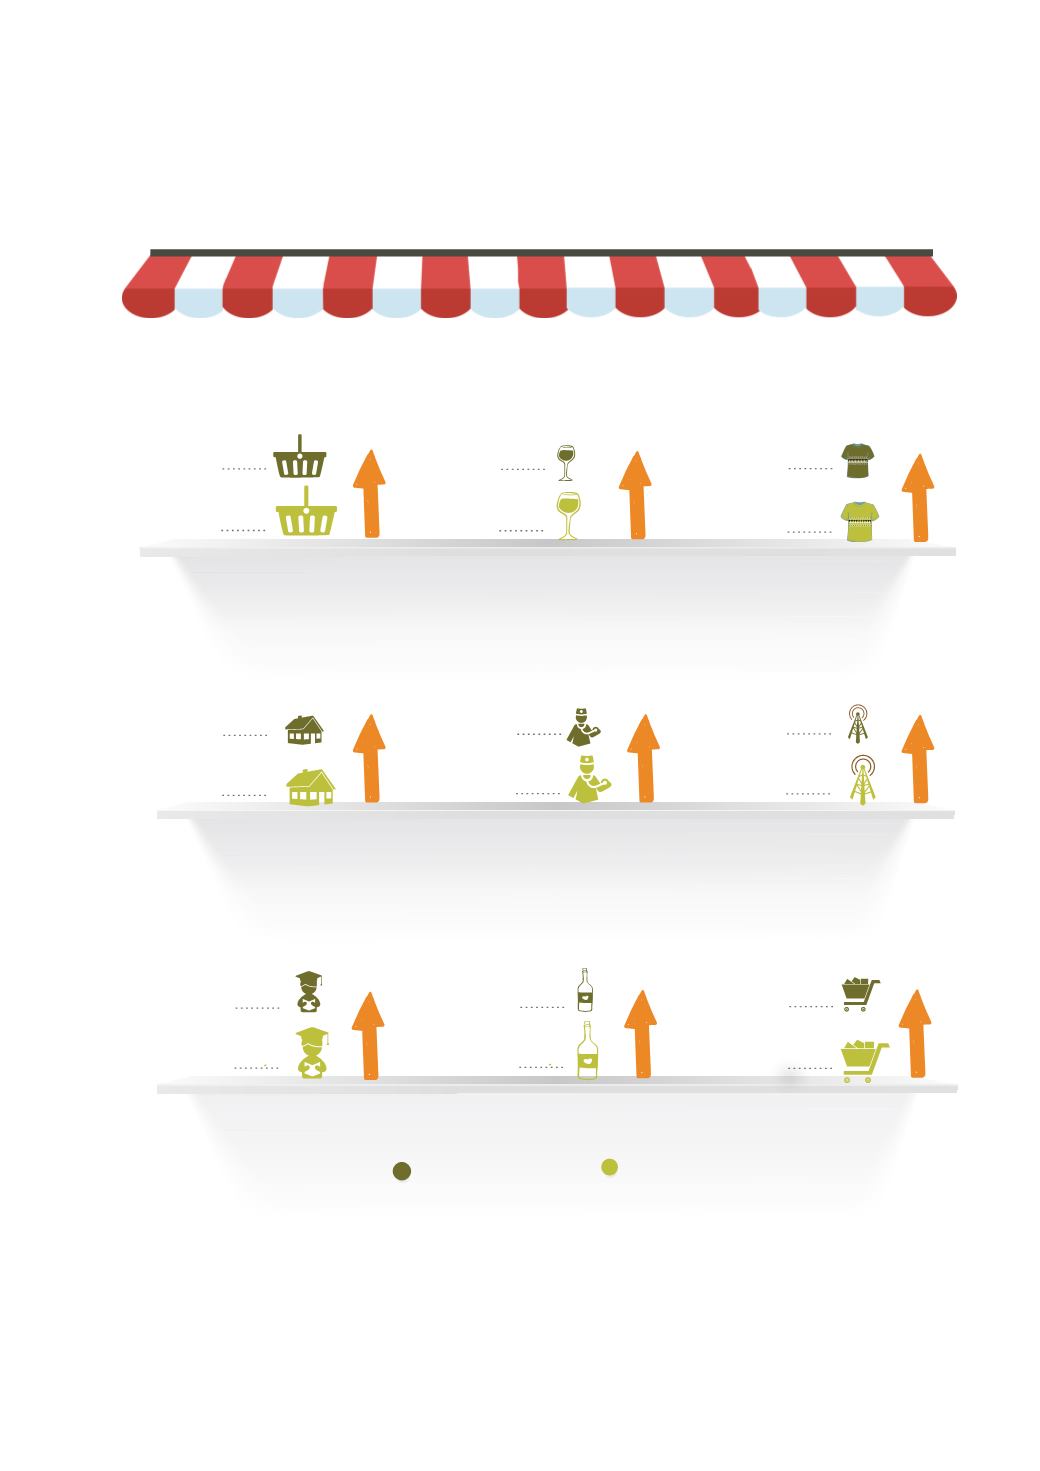
การตรวจรั
กษา และบริ
การส่
วนบุ
คคล
Medical & personal care
เครื่
องนุ่
งห่
ม และรองเท้
า
Apparel & footware
การบั
นเทิ
ง การอ่
าน การศึ
กษา และการศาสนา
Recreation & education
หมวดอื่
นๆ ไม่
ใช่
อาหารและเครื่
องดื่
ม
Non-food & beverages
อาหารและเครื่
องดื่
มไม่
มี
แอลกอฮอล์
Food & non-alcoholic beverages
เคหสถาน
Housing & furnishing
ยาสู
บและเครื่
องดื่
มมี
แอลกอฮอล์
Tobacco & alcoholic beverages
พาหนะ การขนส่
ง และการสื่
อสาร
Transportation & communication
รวมทุ
กรายการ
All Commodity
101.26
101.92
99.90
100.21
101.60
101.71
101.24
101.97
101.37
101.64
100.39
100.69
101.64
102.89
101.28
101.91
0.66%
ที่
มา: สำนั
กดั
ชนี
เศรษฐกิ
จการค้
า
Source: Bureau of Trade and Economic Indices
แผนภู
มิ
3 อั
ตราการเปลี่
ยนแปลงของดั
ชนี
ราคาผู้
บริ
โภค: ไตรมาสที่
1 - 2 พ.ศ. 2561
Figure
3
Percentage Change of Consumer Price Index:
Quarter 1 - 2, 2018
120.29
120.32
1
Quarter
1
2
Quarter
2
0.32%
0.11%
0.26%
0.02%
0.63%
0.72%
0.30%
1.23%


