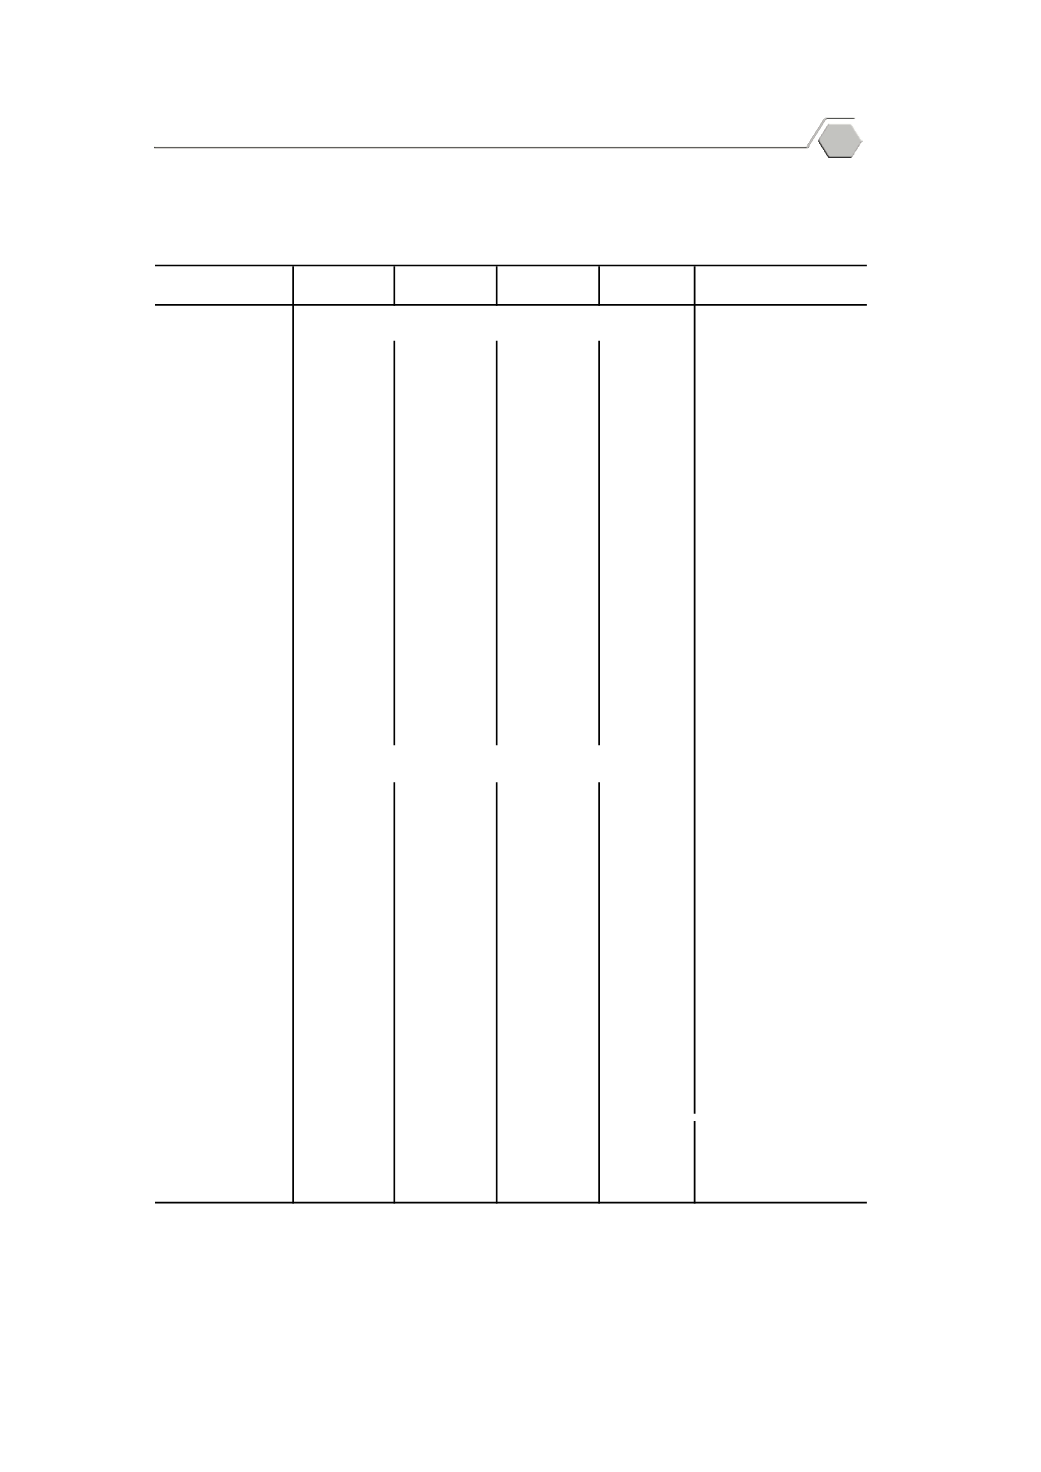
ตาราง
7.1
ปริ
มาณสั
ตว
น้ํ
าของสะพานปลา และท
าเที
ยบเรื
อประมงขององค
การสะพานปลา พ.ศ.
2558
Table
7.1
Quantity of Fresh Fish at Fish Markets and Fishing Ports of The Fish
Marketing Organization
: 2015
มิ
ถุ
นายน
กรกฎาคม
June
July
รวมทั้
งสิ้
น...............
30,298.3
28,360.6
25,005.7
16,280.3
Total
ผ
านการประมู
ล............
30,130.0
28,179.9
24,816.9
16,159.3
Auctioned
สั
ตว
น้ํ
าทะเล..............
29,288.6
27,184.2
24,063.6
15,457.2
Fresh marine fish
ปลาทู
.......................................
1,311.2
1,074.7
1,226.3
861.1
Indo-Pacific mackerel
ปลาทู
แขก...............................
2,545.3
2,203.6
1,741.5
1,330.7
Scads
ปลาลั
ง.....................................
297.4
296.7
286.5
102.2
Indian mackerel
ปลาหมึ
ก.................................
936.0
947.7
942.2
610.8
Squid and cuttlefishs
ปลาเบญจพรรณ..................
18,109.6
16,822.8
14,699.0
9,426.0
Other food fishes
ปลาเป
ด...................................
5,704.2
5,432.1
4,756.0
2,740.5
Trash fishs
กุ
ง.............................................
251.0
264.7
264.1
274.8
Shrimps
กั้
ง.............................................
16.8
7.7
8.9
9.3
Lobster
ปู
...............................................
72.9
87.4
90.0
55.8
Sea crabs
หอย..........................................
44.2
46.8
49.1
46.0
Shellfishes
สั
ตว
น้ํ
าจื
ด.................
841.4
995.7
753.3
702.1
Fresh water fish
ไม
ผ
านการประมู
ล........
168.3
180.7
188.8
121.0
Not auctioned
สั
ตว
น้ํ
าทะเล..............
90.6
96.1
130.8
72.9
Fresh marine fish
สั
ตว
น้ํ
าจื
ด.................
77.7
84.6
58.0
48.1
Fresh water fish
รวมทั้
งสิ้
น............... 1,596,671.1
1,488,803.3
1,252,647.3
883,807.3
Total
ผ
านการประมู
ล............ 1,590,512.0
1,482,396.7
1,246,159.9
878,722.0
Auctioned
สั
ตว
น้ํ
าทะเล.............. 1,549,786.8
1,445,918.7
1,221,186.2
857,561.4
Fresh marine fish
ปลาทู
.......................................
88,294.1
74,485.7
70,980.9
56,693.7
Indo-Pacific mackerel
ปลาทู
แขก...............................
153,564.5
133,516.3
103,753.5
82,469.3
Scads
ปลาลั
ง.....................................
20,062.9
17,800.1
18,126.6
6,642.7
Indian mackerel
ปลาหมึ
ก.................................
63,081.9
65,926.9
61,168.9
38,443.3
Squid and cuttlefishs
ปลาเบญจพรรณ..................
1,151,038.2
1,081,920.2
899,946.1
625,228.2
Other food fishes
ปลาเป
ด...................................
34,121.5
30,193.8
26,402.6
15,423.3
Trash fishs
กุ
ง.............................................
27,411.4
29,777.6
29,049.7
24,530.6
Shrimps
กั้
ง.............................................
2,906.9
1,335.7
1,716.9
1,737.3
Lobster
ปู
...............................................
8,732.8
10,448.1
9,501.4
5,887.0
Sea crabs
หอย..........................................
572.6
514.3
539.6
506.0
Shellfishes
สั
ตว
น้ํ
าจื
ด.................
40,725.2
36,478.0
24,973.7
21,160.6
Fresh water fish
ไม
ผ
านการประมู
ล........
6,159.1
6,406.6
6,487.4
5,085.3
Not auctioned
สั
ตว
น้ํ
าทะเล..............
3,313.2
3,290.3
4,253.6
3,075.5
Fresh marine fish
สั
ตว
น้ํ
าจื
ด.................
2,845.9
3,116.3
2,233.8
2,009.8
Fresh water fish
ที่
มา: องค
การสะพานปลา กระทรวงเกษตรและสหกรณ
Source: The Fish Marketing Organization, Ministry of Agriculture and Co-operatives
ปริ
มาณ
Quantity
(
ตั
น
Ton)
มู
ลค
า
Value
(
พั
นบาท
Thousand Baht)
April
ชนิ
ดสั
ตว
น้ํ
า
Species
เมษายน
พฤษภาคม
May
49
Agriculture and Fishery Statistics


