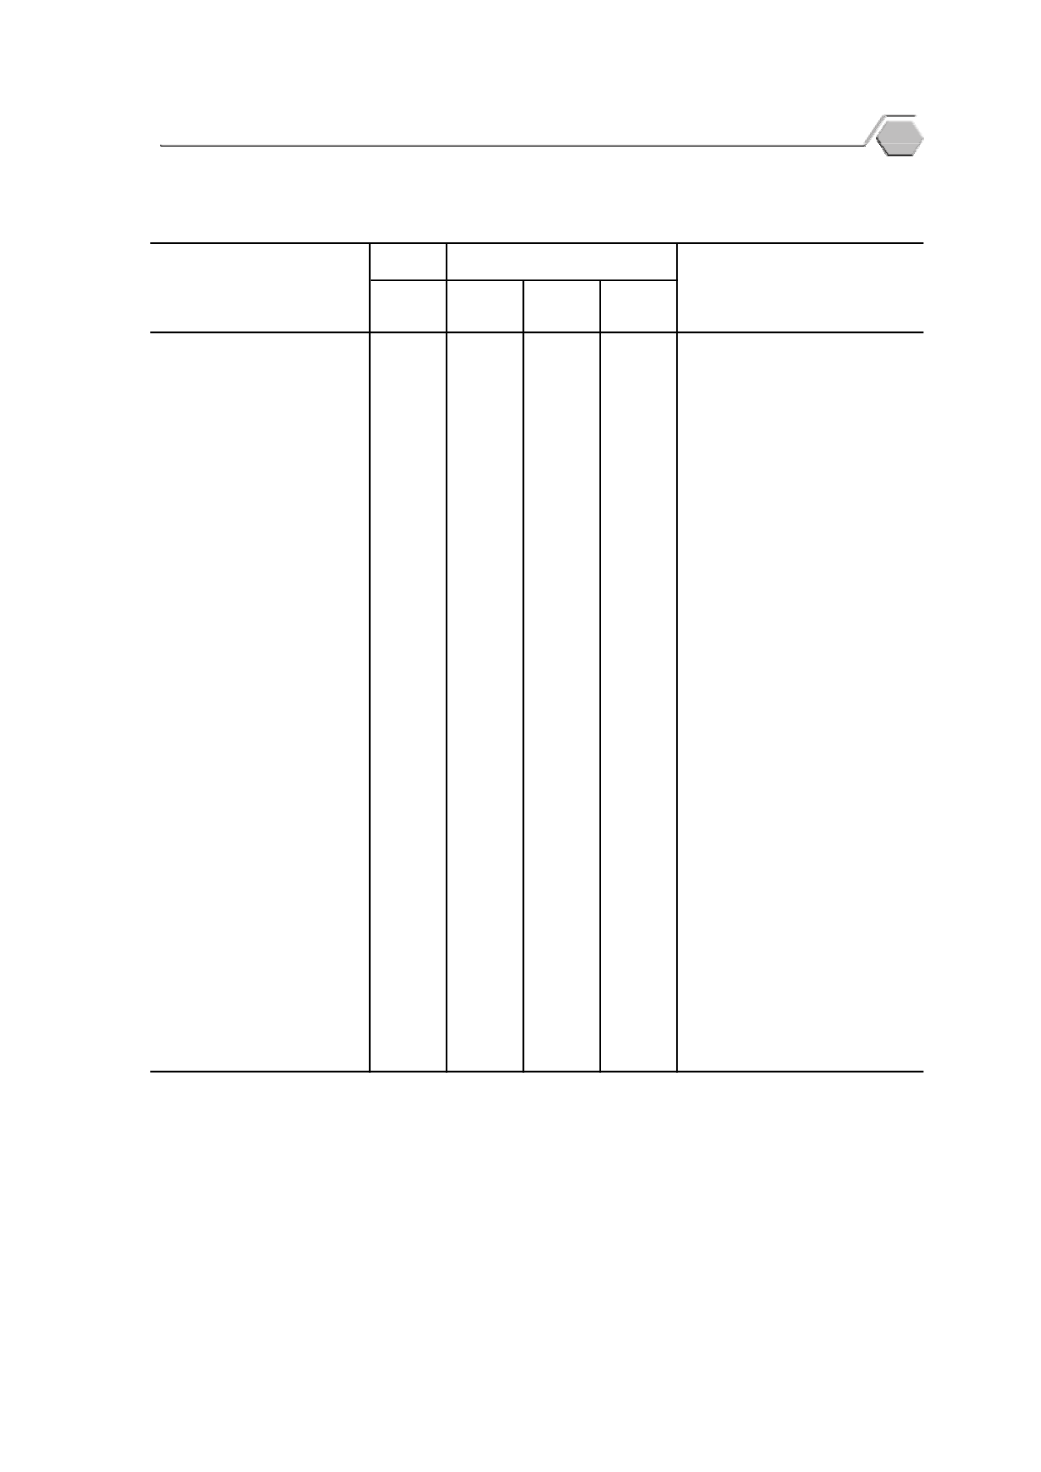
ตาราง
8.1
ผลผลิ
ตภาคอุ
ตสาหกรรม พ.ศ.
2558 - 2559
Table
8.1
Production of Manufactured Goods
: 2015 - 2016
ไตรมาสที่
4
ไตรมาสที่
2 ไตรมาสที่
3
Quarter
4
Quarter
2
Quarter
3
อาหาร (ตั
น)
Food (ton)
ผลไม
และผั
กกระป
อง....................................
213,485
238,133
227,344
145,830
Canned fruit and vetgetable
อาหารทะเลแช
แข็
ง.........................................
40,348
36,369
38,998
43,233
Frozen seafood
เครื่
องดื่
ม (พั
นลิ
ตร)
Beverages (thousand litres)
เบี
ยร
...............................................................
684,404
690,502
569,260
524,651
Beer
โซดาและน้ํ
าดื่
มต
างๆ....................................
747,329
802,872
842,875
646,279
Soda and drinking water
สิ่
งทอและผลิ
ตภั
ณฑ
สิ่
งทอ
Textiles and textile products
ผ
าทอ(ฝ
าย) (พั
นเมตร)...............................
27,890
29,110
24,482
24,045
Cotton fabrics (thousand meters)
เสื้
อผ
าสํ
าเร็
จรู
ป (พั
นชิ้
น).............................
33,987
33,110
29,019
28,471
Garment (thousand pieces)
ผลิ
ตภั
ณฑ
ป
โตรเลี
ยม (ล
านลิ
ตร)
Petroleum products (million litres)
น้ํ
ามั
นเบนซิ
นออกเทน 91............................
559
565
536
549
Gas (unlead) oct
91
น้ํ
ามั
นเบนซิ
นออกเทน 95............................
467
453
389
380
Gas (unlead) oct
95
น้ํ
ามั
นดี
เซลหมุ
นเร็
ว......................................
7,005
6,232
6,048
6,390
Diesel oil high speed
วั
สดุ
ก
อสร
าง (พั
นตั
น)
Construction materials (thousand tons)
ซี
เมนต
ปอร
แลนด
..........................................
7,768.0
8,930.3
8,224.0
7,560.7
Portland cement
ซี
เมนต
ผสม....................................................
1,699.1
1,955.9
1,805.6
1,678.6
Mixed cement
ปู
นเม็
ด.............................................................
9,645.4
12,048.1
10,886.7
10,528.4
Clinkers
เหล็
กและผลิ
ตภั
ณฑ
เหล็
ก (ตั
น)
Iron and steel products (ton)
เหล็
กเส
นข
ออ
อย............................................
375,408
374,815
461,574
379,273
Bar deformd bars
เหล็
กแผ
นเคลื
อบสั
งกะสี
...............................
205,545
211,955
241,824
241,053
Galvanised sheets
ยานยนต
และอุ
ปกรณ
Vehicles and equipments
ยานยนต
(คั
น)...............................................
473,436
491,504
471,143
467,230
Motor vehicles (unit)
ยางรถยนต
(พั
นเส
น)..................................
36,379
39,375
37,304
36,784
Tyre (thousand units)
เครื่
องใช
ไฟฟ
า (พั
นเครื่
อง)
Electrical products (thousand units)
โทรทั
ศน
.........................................................
154
170
114
120
Television
เครื่
องปรั
บอากาศและคอมเพรสเซอร
......
6,311
8,819
9,499
7,536
Air conditioner and compressor
ผลิ
ตภั
ณฑ
เภสั
ชกรรม
Pharmaceuticals,
และเคมี
ภั
ณฑ
ต
างๆ (ตั
น)............................
8,707
8,317
9,233
10,008
Chemicals Products (ton)
ที่
มา: สํ
านั
กงานเศรษฐกิ
จอุ
ตสาหกรรม กระทรวงอุ
ตสาหกรรม
Source: The Office of Industrial Economics, Ministry of Industry
รายการ
Item
2558
(2015)
2559
(2016)
Quarter
1
ไตรมาสที่
1
P
Industrial Statistics
53
r
r
r
r
r
r
r
r
r
r
r
r
r


