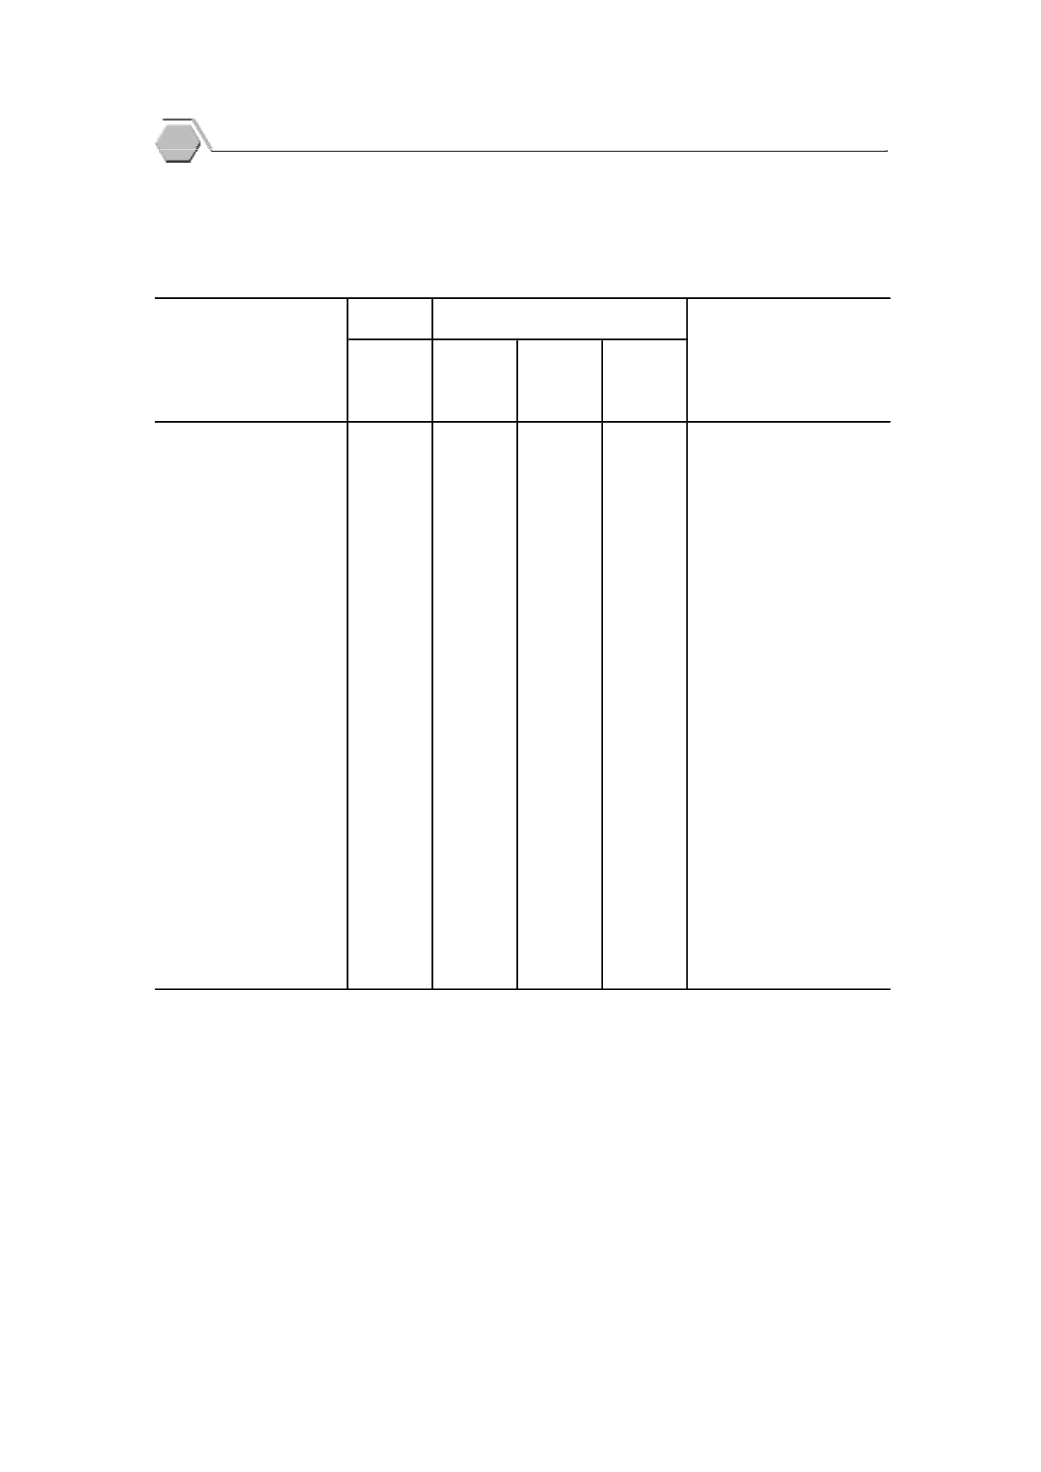
ตาราง
10.4
มู
ลค
าสิ
นค
าขาเข
า
10
อั
นดั
บแรกของไทย พ.ศ.
2560 - 2561
Table
10.4
Top Ten Value of Imports of Thailand
: 2017 - 2018
(ล
านบาท
Million Baht
)
2560 (2017)
ไตรมาสที่
4 ไตรมาสที่
1 ไตรมาสที่
2 ไตรมาสที่
3
Quarter
4
Quarter
1
Quarter
2
Quarter
3
น้ํ
ามั
นดิ
บ.....................................................
191,759.0
198,640.0
212,097.8
243,853.5
Crude
oil
เครื่
องจั
กรกลและส
วนประกอบ.............
171,983.7
162,475.2
166,367.4
169,362.8
Machinery
and
parts
เครื่
องจั
กรไฟฟ
าและส
วนประกอบ.........
149,749.9
140,934.2
153,805.6
167,867.4
Electrical machinery
and
parts
เคมี
ภั
ณฑ
....................................................
122,593.2
133,577.4
134,146.6
139,379.1
Chemicals
เครื่
องเพชรพลอย
อั
ญมณี
Jewellery
including
silver
bars
เงิ
นแท
ง และทองคํ
า...............................
152,404.3
126,751.4
82,840.2
187,899.3
and
gold
ส
วนประกอบและอุ
ปกรณ
ยานยนต
.......
95,728.8
93,867.1
96,266.5
98,749.8
Parts
and
accessories
of
vehicles
เหล็
ก
เหล็
กกล
าและผลิ
ตภั
ณฑ
...............
99,385.7
103,588.7
106,670.5
116,796.5
Iron,
steel
and
products
แผงวงจรไฟฟ
า..........................................
92,055.7
91,084.8
93,298.5
102,342.9
Electronic
integrated
circuites
สิ
นแร
โลหะอื่
น ๆ เศษโลหะ
Other metal
ores, metal
waste
และผลิ
ตภั
ณฑ
.......................................
75,552.2
80,636.1
80,985.5
83,168.9
scrap, and products
เครื่
องคอมพิ
วเตอร
อุ
ปกรณ
Computers,
parts
and
และส
วนประกอบ....................................
69,385.7
68,891.8
71,767.6
77,980.4
accessories
หมายเหตุ
: เรี
ยงลํ
าดั
บตามมู
ลค
าสิ
นค
าขาเข
า 10 อั
นดั
บแรกของ พ.ศ. 2560
Note
:
Top Ten value of Thailand's imported commodities presented in order of magnitude in
2017.
ที่
มา: สํ
านั
กงานปลั
ดกระทรวงพาณิ
ชย
กระทรวงพาณิ
ชย
Source
:
Office of the Permanent Secretary, Ministry of Commerce
สิ
นค
า
Commodity
2561 (2018)
66
สถิ
ติ
การค
า และราคา
p


