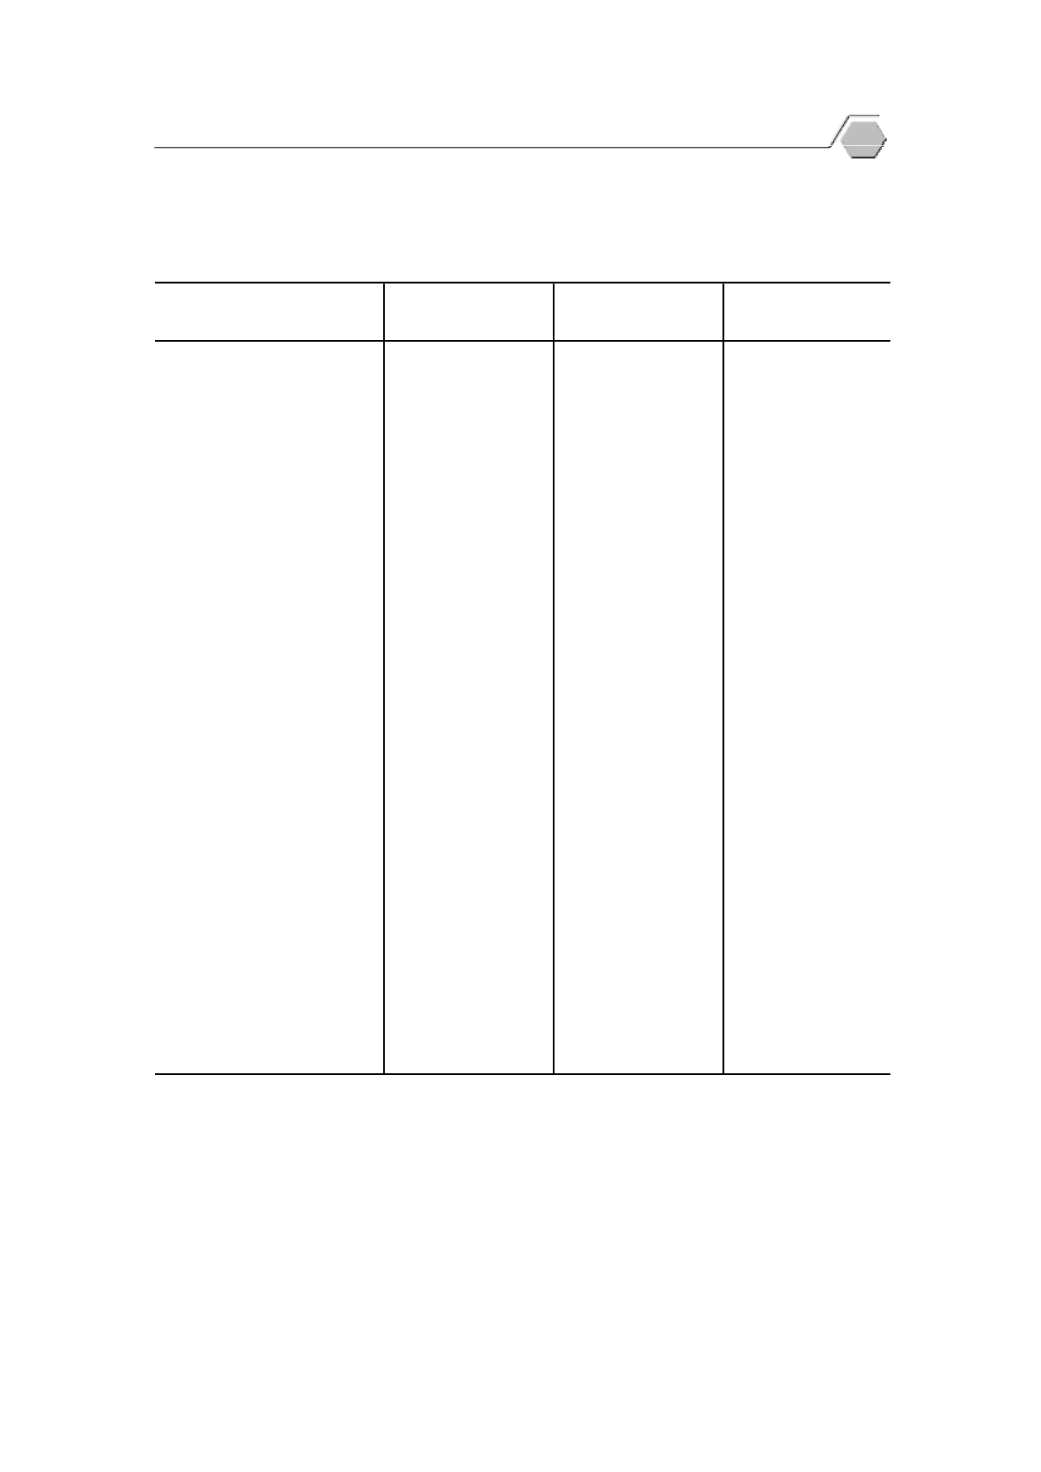
ตาราง
10.1
มู
ลค
าของสิ
นค
าขาเข
า และขาออก พ.ศ.
2555 - 2562
Table
10.1
Value of Imports and Exports
: 2012 - 2019
(ล
านบาท
Million Baht)
ป
สิ
นค
าขาเข
า
สิ
นค
าขาออก
(1)
ดุ
ลการค
า
(2)
Year
Imports
Exports
Balance of trade
2555 (2012)
……………………………………………
7,786,123.0
7,077,762.2
-708,360.9
2556 (2013)
……………………………………………
7,657,633.1
6,909,543.9
-748,089.2
2557 (2014)……………………………………………………
7,403,904.8
7,311,089.0
-92,815.8
2558 (2015)
………………………………………….
6,906,078.4
7,225,722.8
+319,644.4
2559 (2016)
…………………………..………………
6,888,186.7
7,550,704.1
+662,517.4
2560 (2017)
………………………………………….
7,587,118.4
8,006,265.2
+419,146.8
ม.ค. - มี
.ค.
Jan. - Mar. .....................
1,852,307.2
1,981,874.7
+129,567.5
เม.ย. - มิ
.ย.
Apr. - Jun. .……...............
1,863,880.6
1,950,976.2
+87,095.6
ก.ค. - ก.ย.
Jul. - Sep. .......................
1,903,987.6
2,069,065.5
+165,077.9
ต.ค. - ธ.ค.
Oct.- Dec. …….................
1,966,943.0
2,004,348.8
+37,405.8
2561 (2018)
………………………………………….
8,064,038.9
8,108,299.8
+44,260.9
ม.ค. - มี
.ค.
Jan. - Mar. .....................
1,952,565.5
2,007,698.2
+55,132.6
เม.ย. - มิ
.ย.
Apr. - Jun. .……...............
1,941,277.1
1,982,442.9
+41,165.8
ก.ค. - ก.ย.
Jul. - Sep. .......................
2,126,447.4
2,094,255.8
-32,191.6
ต.ค. - ธ.ค.
Oct.- Dec. …….................
2,043,748.9
2,023,903.0
-19,845.9
2562 (2019)
มกราคม
January.............................
660,641.2
654,937.0
-5,704.2
กุ
มภาพั
นธ
February............................
558,778.0
678,509.1
+119,731.1
มี
นาคม
March................................
595,475.9
626,011.4
+30,535.5
เมษายน
April..................................
666,810.3
663,647.0
-3,163.3
พฤษภาคม
May....................................
756,664.4
616,103.8
-140,560.7
มิ
ถุ
นายน
June...................................
583,093.8
676,838.4
+93,744.6
กรกฎาคม
July....................................
609,512.4
663,224.7
+53,712.4
สิ
งหาคม
August...............................
637,381.4
582,984.9
-54,396.5
กั
นยายน
September........................
616,376.6
670,452.2
+54,075.7
(1) รวมสิ
นค
าส
งกลั
บ
Including re-exports.
(2) สิ
นค
าขาออกสู
งกว
าสิ
นค
าขาเข
า (+) สิ
นค
าขาเข
าสู
งกว
าสิ
นค
าขาออก (-)
Excess of exports (+), excess of imports (-).
ที่
มา: สํ
านั
กงานปลั
ดกระทรวงพาณิ
ชย
กระทรวงพาณิ
ชย
Source: Office of the Permanent Secretary, Ministry of Commerce
Trade and Price Statistics
89
r
p


