µ¦µ
1.1
¦³µ¦°µ¥»
15
e
¹Ê
Å Î
µÂµ¤µ£µ¡Â¦µ Á¡« ¨³Á
µ¦¦° ¡.«.
2557
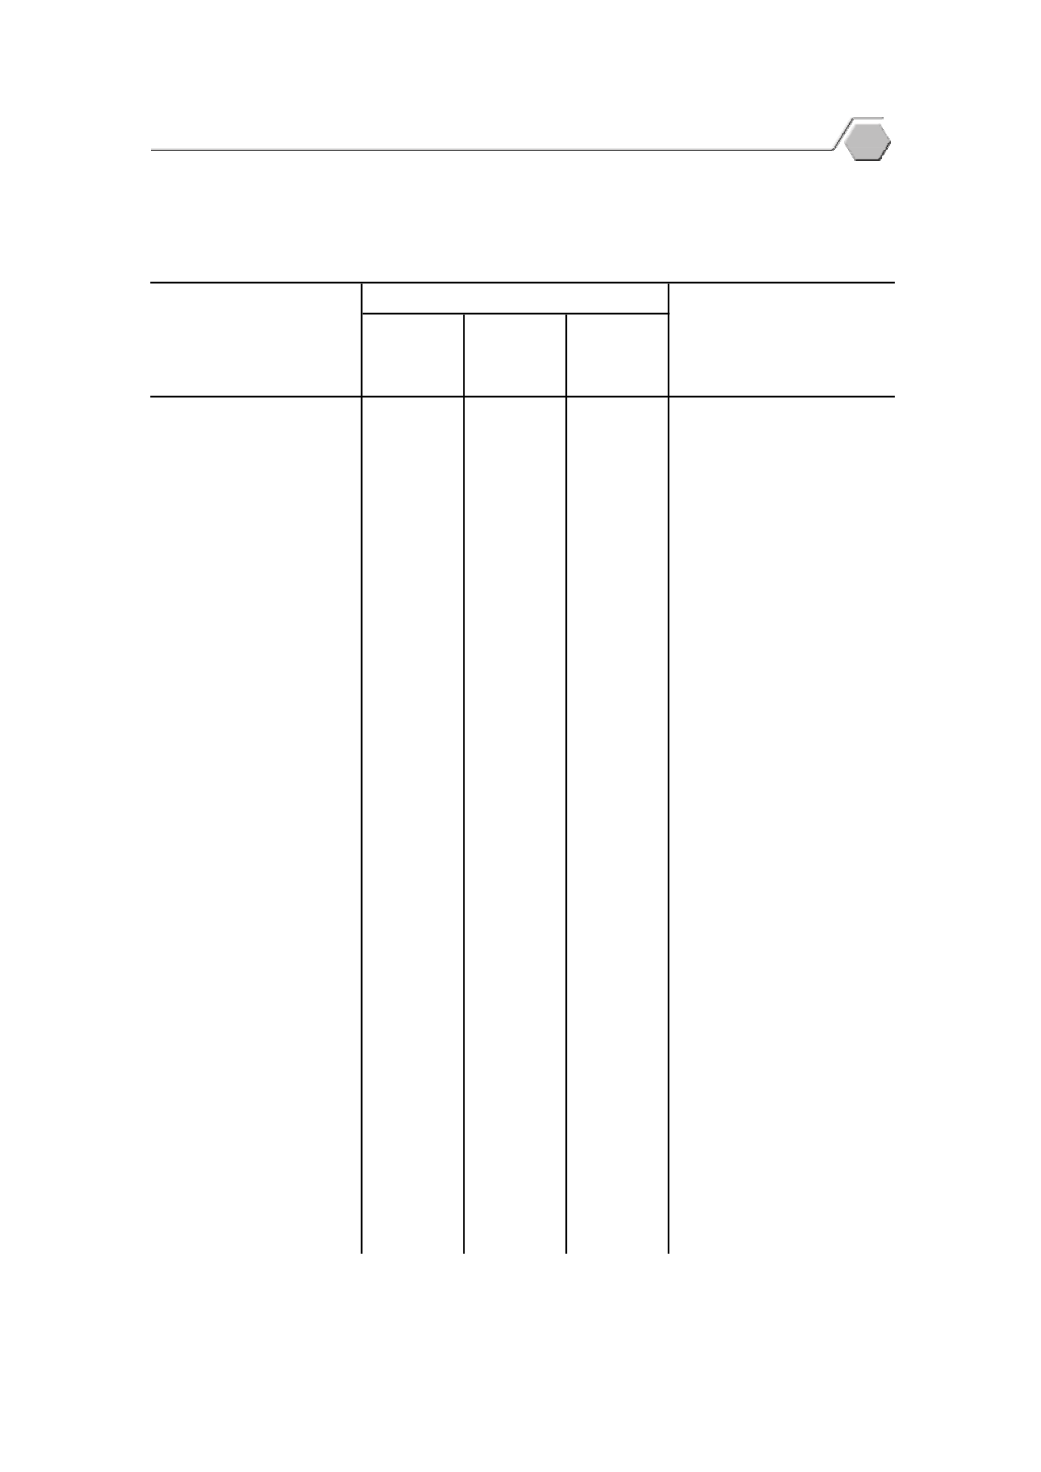
Table
1.1
Population
15
Years and Over by Labour Force Status, Sex and Area
: 2014
(¡´
Thousand persons)
54,992.9
24,964.3
30,028.5
Î
µ¨´
¦µ¦ª¤............................................
38,597.6
17,405.7
21,191.8
Total labour force
Î
µ¨´
¦µ{
»
´
................................
38,499.3
17,378.8
21,120.5
Current labour force
¼o
¤¸
µÎ
µ...............................................
38,262.1
17,260.7
21,001.4
Employed
Î
µµ................................................
38,035.5
17,183.4
20,852.2
At work
Ťn
Î
µµÂn
¤¸
µ¦³Î
µ................
226.5
77.3
149.3
With job but not at work
¼o
ªn
µµ................................................
237.3
118.2
119.1
Unemployed
®µµÎ
µ...........................................
50.4
29.2
21.3
Looking for work
Ťn
®µµÎ
µ/¡¦o
°¤¸É
³Î
µµ.....
186.9
89.0
97.8
Not looking/available for work
Î
µ¨´
¦µ¸É
¦°§¼
µ¨........................
98.3
26.9
71.4
Seasonally inactive labour force
¼o
Ťn
°¥¼n
ÄÎ
µ¨´
¦µ...................................
16,395.3
7,558.6
8,836.7
Persons not in labour force
Î
µµo
µ.................................................h 4,910.4
2,191.4
2,719.0
Household work
Á¦¸
¥®´
º
°................................................
4,463.5
2,192.4
2,271.1
Studies
¥´
ÁÈ
¦µ/Ťn
µ¤µ¦Î
µµÅo
...........
5,386.4
2,182.4
3,204.0
Too young/old/incapable of work
°ºÉ
Ç.............................................................
1,635.1
992.5
642.6
Others
26,596.6
11,954.9
14,641.7
Î
µ¨´
¦µ¦ª¤............................................
21,024.3
9,272.8
11,751.5
Total labour force
Î
µ¨´
¦µ{
»
´
................................
20,967.0
9,257.5
11,709.5
Current labour force
¼o
¤¸
µÎ
µ...............................................
20,810.0
9,175.0
11,635.0
Employed
Î
µµ................................................
20,668.8
9,127.1
11,541.8
At work
Ťn
Î
µµÂn
¤¸
µ¦³Î
µ................
141.2
47.9
93.2
With job but not at work
¼o
ªn
µµ................................................
157.0
82.5
74.4
Unemployed
®µµÎ
µ...........................................
34.8
22.8
12.0
Looking for work
Ťn
®µµÎ
µ/¡¦o
°¤¸É
³Î
µµ.....
122.2
59.8
62.4
Not looking/available for work
Î
µ¨´
¦µ¸É
¦°§¼
µ¨........................
57.3
15.2
42.1
Seasonally inactive labour force
¼o
Ťn
°¥¼n
ÄÎ
µ¨´
¦µ...................................
5,572.3
2,682.1
2,890.2
Persons not in labour force
Î
µµo
µ.................................................h
176.4
92.2
84.2
Household work
Á¦¸
¥®´
º
°................................................
2,120.8
1,066.2
1,054.6
Studies
¥´
ÁÈ
¦µ/Ťn
µ¤µ¦Î
µµÅo
...........
2,319.1
924.3
1,394.8
Too young/old/incapable of work
°ºÉ
Ç.............................................................
956.1
599.4
356.6
Others
area
area
Ŧ¤µ¸É
4/2557
Quarter
4/2014
ÄÁ
Á«µ¨
¦ª¤¥°
Male
Labour force status
Total
°Á
Á«µ¨
Total
µ£µ¡Â¦µ
Municipal
Non-municipal
¦ª¤¥°.......................
µ¥...........................
Labour Statistics
3


