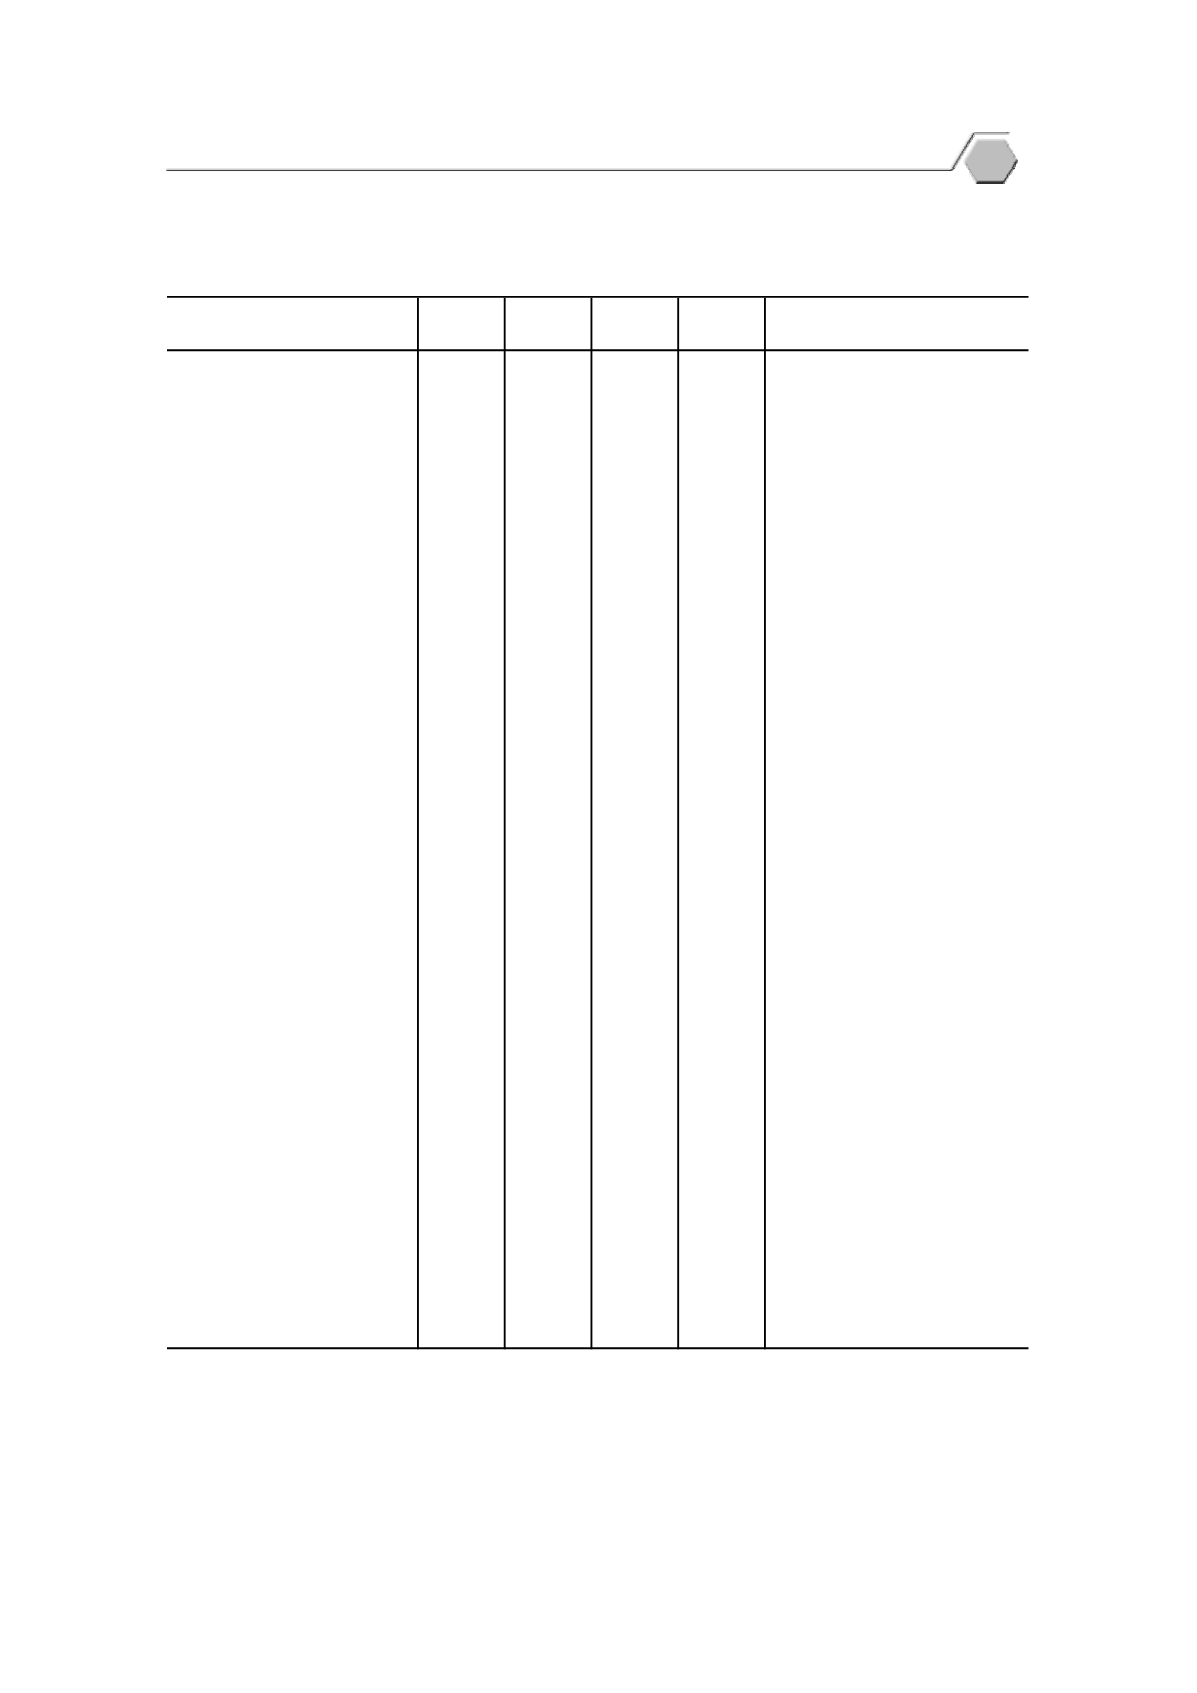
ตาราง
6.3
รายจ
ายเพื่
อการอุ
ปโภคบริ
โภค ตามราคาประจํ
าป
จํ
าแนกตามประเภทรายจ
าย พ.ศ.
2559
Table
6.3
Consumption Expenditure at Current Market Prices by Type of Expenditure
: 2016
(ล
านบาท
Million Baht
)
ไตรมาสที่
1 ไตรมาสที่
2 ไตรมาสที่
3 ไตรมาสที่
4
Quarter
1
Quarter
2
Quarter
3
Quarter
4
อาหารและเครื่
องดื่
มที่
ไม
มี
แอลกอฮอล
...............
528,900
529,517
542,340
474,503
Food and non-alcoholic
เครื่
องดื่
มที่
มี
แอลกอฮอล
ยาสู
บ
Alcoholic beverages, tobacco
และยาเสพติ
ด........................................................
72,774
71,776
64,240
75,387
and narcotic
เสื้
อผ
า และรองเท
า.................................................
77,747
81,437
88,335
124,402
Clothing and footwear
ที่
อยู
อาศั
ย ประปา ไฟฟ
า ก
าซ
Housing, water, electricity, gas and
และเชื้
อเพลิ
งอื่
นๆ.................................................
180,425
189,306
182,556
183,120
other fuels
เครื่
องเรื
อน เครื่
องใช
และการบํ
ารุ
ง
Furnishings, households equipment and
รั
กษาครั
วเรื
อน....................................................
86,837
85,279
82,370
81,684
routine maintenance of the house
การรั
กษาพยาบาล.................................................
93,806
94,124
94,321
96,405
Health
การขนส
ง.................................................................
258,846
274,465
271,461
276,885
Transport
การสื่
อสารและโทรคมนาคม................................
39,016
43,038
40,079
46,860
Communication
บั
นเทิ
งและนั
นทนาการ...........................................
108,881
105,484
111,496
110,166
Recreation and culture
การศึ
กษา.................................................................
24,339
27,234
25,750
26,288
Education
ภั
ตตาคารและโรงแรม............................................
362,053
372,070
373,619
341,628
Restaurants and hotels
สิ
นค
าและบริ
การเบ็
ตเตล็
ด....................................
234,760
252,165
263,300
277,409
Miscellaneous goods and services
การใช
จ
ายเพื่
อการอุ
ปโภคบริ
โภค
Consumption expenditure
ของครั
วเรื
อน........................................ 2,068,384 2,125,895 2,139,867 2,114,737
of households
บวก: การใช
จ
ายเพื่
อการอุ
ปโภคบริ
โภคของ
Plus: Individual consumption expenditure
สถาบั
นไม
แสวงหากํ
าไรให
บริ
การ
by non-profit institutions serving
ครั
วเรื
อน......................................................
37,128
31,029
34,339
41,900
households (NPISHs)
การใช
จ
ายเพื่
อการอุ
ปโภคบริ
โภค
Private final consumption
ขั้
นสุ
ดท
ายของเอกชน ตลาดในประเทศ.. 2,105,512 2,156,924 2,174,206 2,156,637
expenditure in the domestic market
บวก: คนไทยใช
จ
ายในต
างประเทศ....................
66,944
69,710
66,400
76,358
Plus: Expenditure of residents abroad
Less: Expenditure of non-residents
หั
ก: คนต
างประเทศใช
จ
ายในประเทศไทย.......
447,108
350,708
399,476
396,190
in the country
รายจ
ายเพื่
อการอุ
ปโภคบริ
โภคขั้
นสุ
ดท
าย
ของเอกชน…............................................. 1,725,348 1,875,926 1,841,130 1,836,805
Private final consumption expenditure
ค
าตอบแทนแรงงาน...............................................
331,826
332,012
345,864
334,173
Compensation of employees
การสะสมทุ
นถาวรเบื้
องต
น..................................
67,495
67,766
69,392
66,411
Consumption of fixed capital
ค
าใช
จ
ายในการซื้
อสิ
นค
าและบริ
การสุ
ทธิ
..........
173,264
185,940
205,105
160,597
Purchase from enterprises and abroad
หั
ก: รายได
จากการขายสิ
นค
าและ
Less: Purchases by households
บริ
การให
ครั
วเรื
อนและผู
ประการการ.......
31,073
39,437
38,515
23,081
and enterprises
การโอนเพื่
อสวั
สดิ
การและสั
งคม
ที่
ไม
เป
นตั
วเงิ
นสํ
าหรั
บสิ
นค
า
Social transfers in kind purchased
และบริ
การในระบบตลาด...................................
62,580
59,584
45,212
78,861
market production
รายจ
ายเพื่
อการอุ
ปโภคขั้
นสุ
ดท
าย
General government final
ของรั
ฐบาล...............................................
604,092
605,865
627,058
616,961
consumption expenditure
หมายเหตุ
: ตั
วเลขเบื้
องต
น
Note: Preliminary.
ที่
มา: สํ
านั
กงานคณะกรรมการพั
ฒนาการเศรษฐกิ
จและสั
งคมแห
งชาติ
สํ
านั
กนายกรั
ฐมนตรี
Source: Office of the National Economic and Social Development Board, Office of the Prime Minister
Type of expenditure
ประเภทรายจ
าย
43
National Accounts


