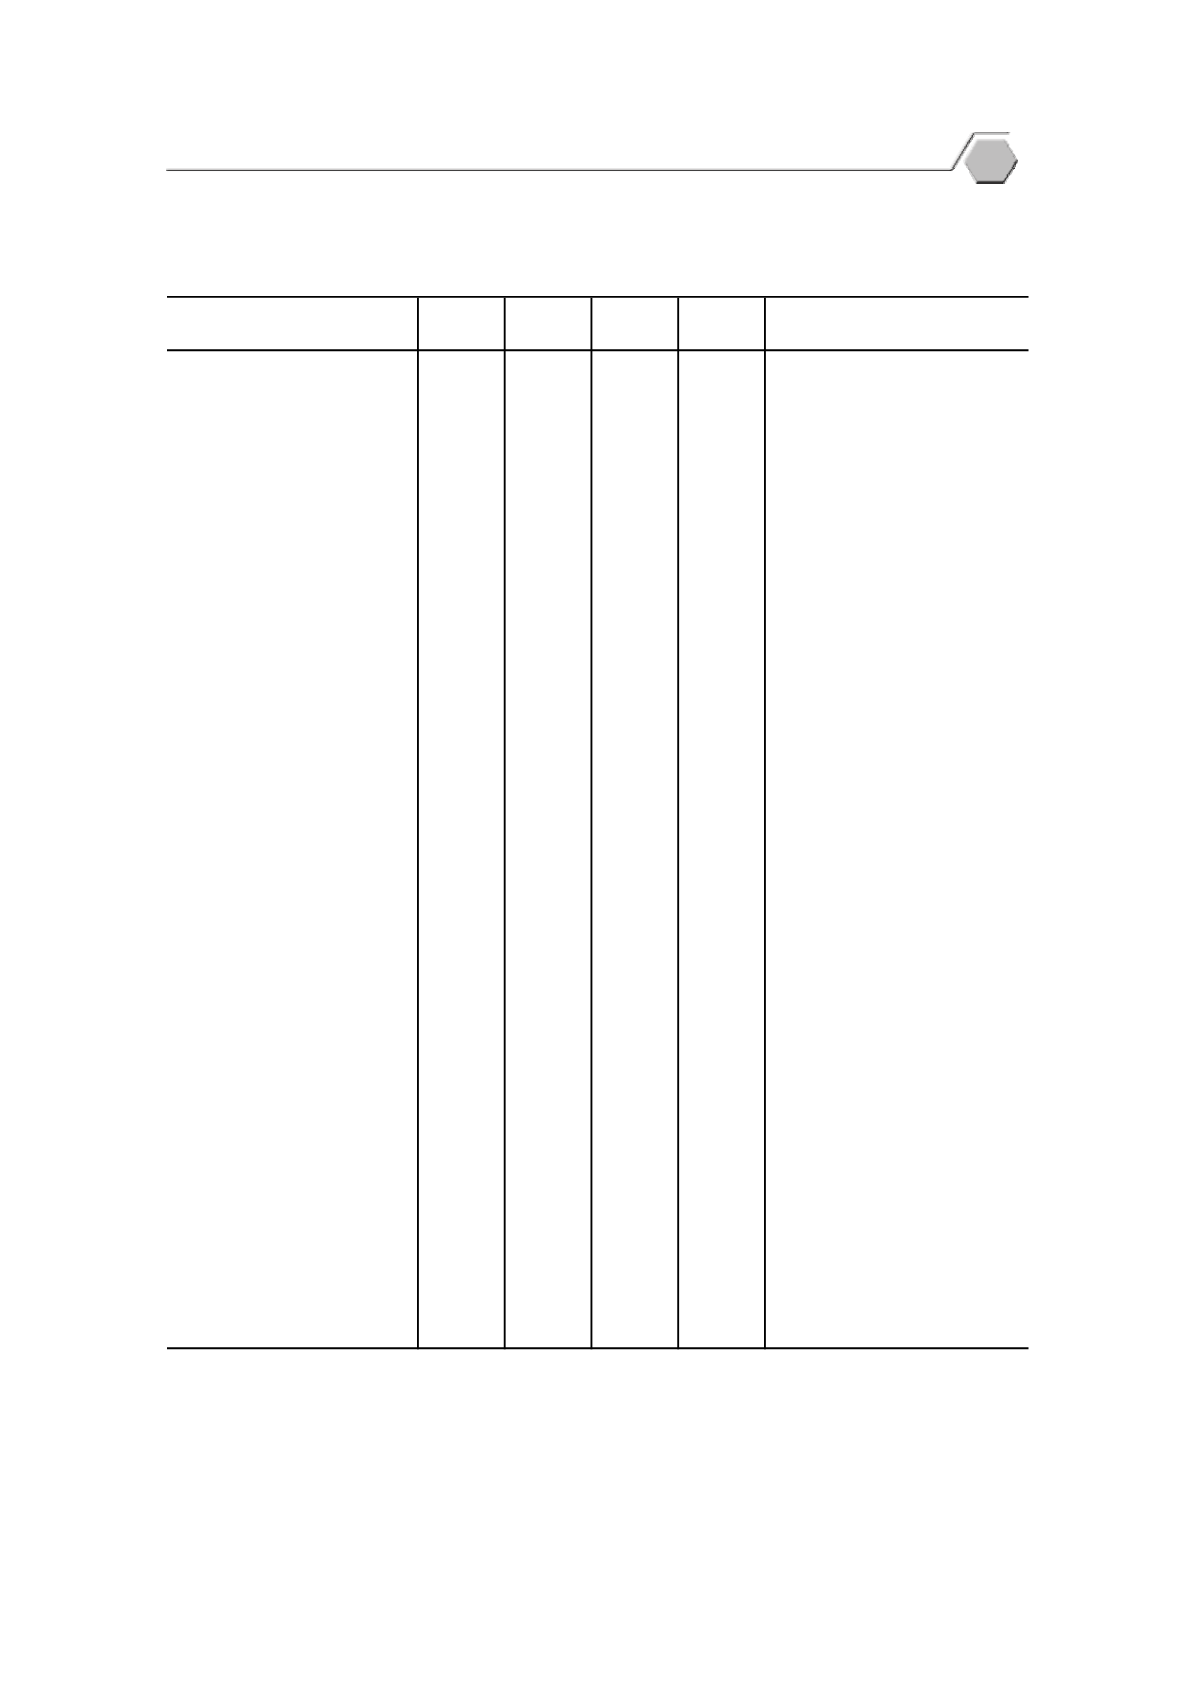
ตาราง
6.3
รายจ
ายเพื่
อการอุ
ปโภคบริ
โภค ตามราคาประจํ
าป
จํ
าแนกตามประเภทรายจ
าย พ.ศ.
2560
Table
6.3
Consumption Expenditure at Current Market Prices by Type of Expenditure
: 2017
(ล
านบาท
Million Baht
)
ไตรมาสที่
1 ไตรมาสที่
2 ไตรมาสที่
3 ไตรมาสที่
4
Quarter
1
Quarter
2
Quarter
3
Quarter
4
อาหารและเครื่
องดื่
มที่
ไม
มี
แอลกอฮอล
...............
540,919
515,372
544,548
478,791
Food and non-alcoholic
เครื่
องดื่
มที่
มี
แอลกอฮอล
ยาสู
บ
Alcoholic beverages, tobacco
และยาเสพติ
ด........................................................
71,794
71,207
67,062
77,190
and narcotic
เสื้
อผ
า และรองเท
า.................................................
79,654
83,668
89,264
122,971
Clothing and footwear
ที่
อยู
อาศั
ย ประปา ไฟฟ
า ก
าซ
Housing, water, electricity, gas and
และเชื้
อเพลิ
งอื่
นๆ.................................................
186,171
192,746
192,303
197,992
other fuels
เครื่
องเรื
อน เครื่
องใช
และการบํ
ารุ
ง
Furnishings, households equipment and
รั
กษาครั
วเรื
อน....................................................
83,122
84,642
82,795
83,364
routine maintenance of the house
การรั
กษาพยาบาล.................................................
98,617
97,558
98,147
96,439
Health
การขนส
ง.................................................................
287,357
299,532
289,637
318,058
Transport
การสื่
อสารและโทรคมนาคม................................
41,493
46,163
41,769
48,239
Communication
บั
นเทิ
งและนั
นทนาการ...........................................
124,206
121,974
128,344
131,629
Recreation and culture
การศึ
กษา.................................................................
26,077
29,956
27,522
28,870
Education
ภั
ตตาคารและโรงแรม............................................
371,469
393,218
407,732
382,610
Restaurants and hotels
สิ
นค
าและบริ
การเบ็
ตเตล็
ด....................................
245,570
267,497
276,704
287,877
Miscellaneous goods and services
การใช
จ
ายเพื่
อการอุ
ปโภคบริ
โภค
Consumption expenditure
ของครั
วเรื
อน........................................ 2,156,449 2,203,533 2,245,827 2,254,030
of households
บวก: การใช
จ
ายเพื่
อการอุ
ปโภคบริ
โภคของ
Plus: Individual consumption expenditure
สถาบั
นไม
แสวงหากํ
าไรให
บริ
การ
by non-profit institutions serving
ครั
วเรื
อน......................................................
38,906
32,789
37,755
43,293
households (NPISHs)
การใช
จ
ายเพื่
อการอุ
ปโภคบริ
โภค
Private final consumption
ขั้
นสุ
ดท
ายของเอกชน ตลาดในประเทศ.. 2,195,355 2,236,322 2,283,582 2,297,323
expenditure in the domestic market
บวก: คนไทยใช
จ
ายในต
างประเทศ....................
74,842
80,759
69,979
82,779
Plus: Expenditure of residents abroad
Less: Expenditure of non-residents
หั
ก: คนต
างประเทศใช
จ
ายในประเทศไทย.......
477,956
395,418
436,647
472,718
in the country
รายจ
ายเพื่
อการอุ
ปโภคบริ
โภคขั้
นสุ
ดท
าย
ของเอกชน…............................................. 1,792,241 1,921,663 1,916,914 1,907,384
Private final consumption expenditure
ค
าตอบแทนแรงงาน...............................................
339,148
344,187
366,645
353,518
Compensation of employees
การสะสมทุ
นถาวรเบื้
องต
น..................................
71,809
71,693
72,603
72,061
Consumption of fixed capital
ค
าใช
จ
ายในการซื้
อสิ
นค
าและบริ
การสุ
ทธิ
..........
167,448
164,788
211,618
157,508
Purchase from enterprises and abroad
หั
ก: รายได
จากการขายสิ
นค
าและ
Less: Purchases by households
บริ
การให
ครั
วเรื
อนและผู
ประการการ.......
35,138
33,949
35,344
35,483
and enterprises
การโอนเพื่
อสวั
สดิ
การและสั
งคม
ที่
ไม
เป
นตั
วเงิ
นสํ
าหรั
บสิ
นค
า
Social transfers in kind purchased
และบริ
การในระบบตลาด...................................
56,010
72,046
51,179
99,673
market production
รายจ
ายเพื่
อการอุ
ปโภคขั้
นสุ
ดท
าย
General government final
ของรั
ฐบาล...............................................
599,277
618,765
666,701
647,277
consumption expenditure
หมายเหตุ
: ตั
วเลขเบื้
องต
น
Note: Preliminary.
ที่
มา: สํ
านั
กงานคณะกรรมการพั
ฒนาการเศรษฐกิ
จและสั
งคมแห
งชาติ
สํ
านั
กนายกรั
ฐมนตรี
Source: Office of the National Economic and Social Development Board, Office of the Prime Minister
ประเภทรายจ
าย
Type of expenditure
43
National Accounts


