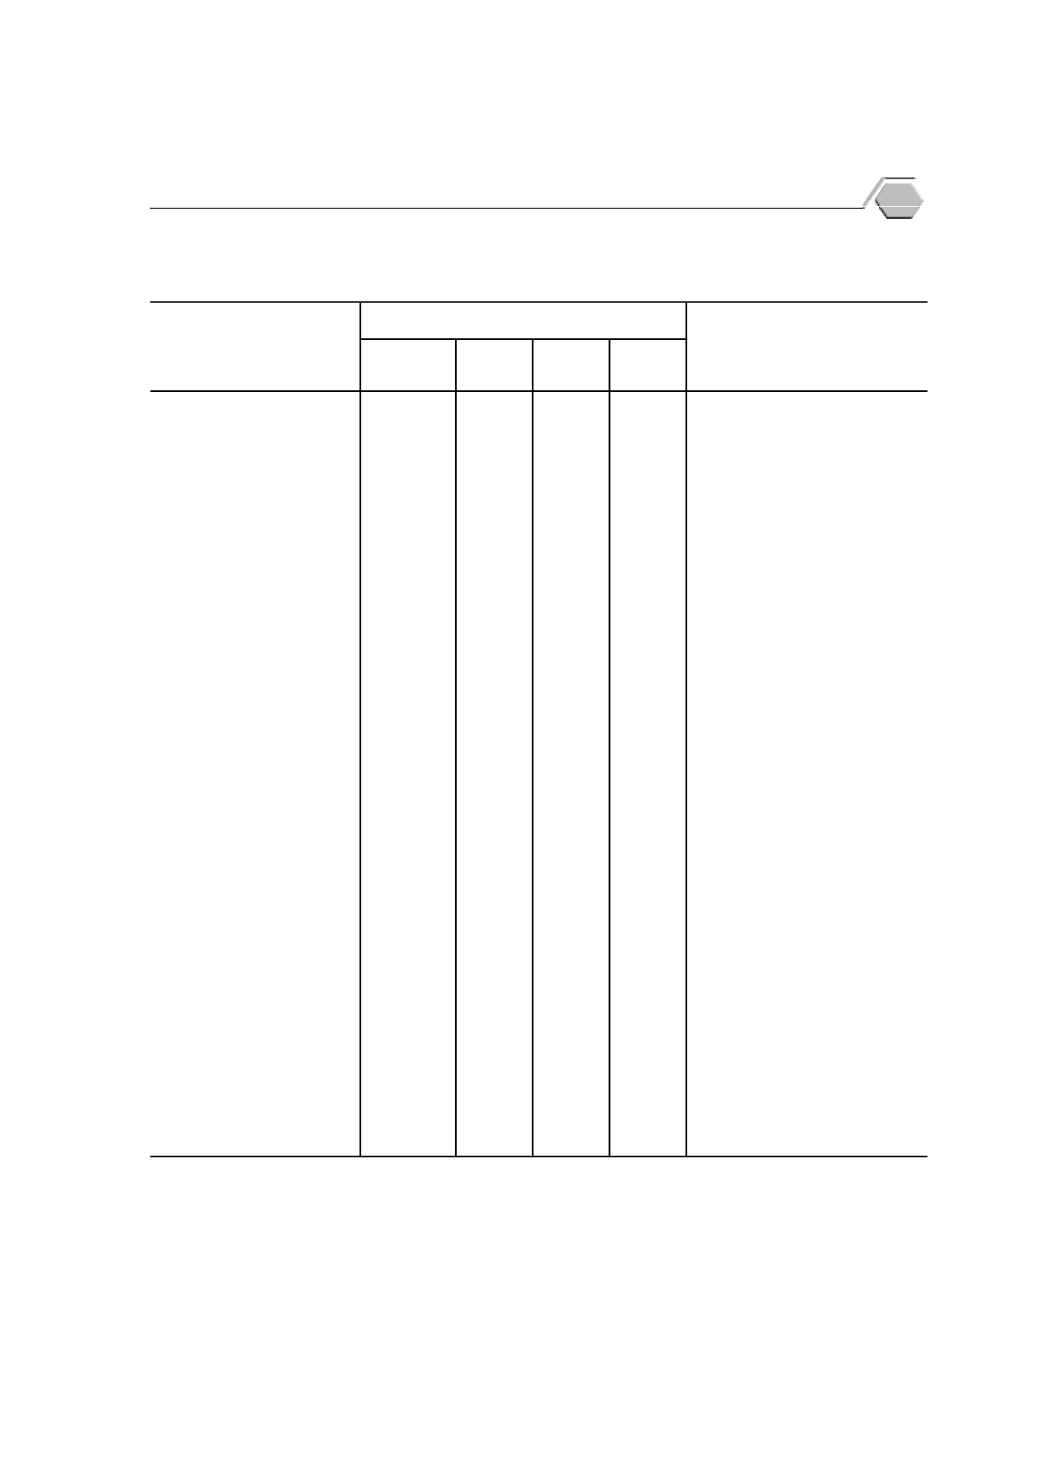
ตาราง
8.1
ผลผลิ
ตภาคอุ
ตสาหกรรม พ.ศ.
2560
Table
8.1
Production of Manufactured Goods
: 2017
อาหาร (ตั
น)
Food (ton)
ผลไม
และผั
กกระป
อง................................
207,258
65,575 75,111 66,572
Canned fruit and vegetable
อาหารทะเลแช
แข็
ง.....................................
44,182
15,311 15,705 13,166
Frozen seafood
เครื่
องดื่
ม (พั
นลิ
ตร)
Beverages (thousand litres)
เบี
ยร
...........................................................
561,362
153,115 204,823 203,424
Beer
โซดาและน้ํ
าดื่
มต
างๆ.................................
1,017,286
333,414 341,363 342,509
Soda and drinking water
สิ่
งทอและผลิ
ตภั
ณฑ
สิ่
งทอ
Textiles and textile products
ผ
าทอ(ฝ
าย) (พั
นเมตร)............................
24,862
8,592 8,215 8,055
Cotton fabrics (thousand meters)
เสื้
อผ
าสํ
าเร็
จรู
ป (พั
นชิ้
น).........................
28,880
9,752 9,695 9,433
Garment (thousand pieces)
ผลิ
ตภั
ณฑ
ป
โตรเลี
ยม (ล
านลิ
ตร)
Petroleum products (million litres)
น้ํ
ามั
นเบนซิ
นออกเทน 91........................
574
204
196
174
Gas (unlead) oct
91
น้ํ
ามั
นเบนซิ
นออกเทน 95........................
501
175
159
167
Gas (unlead) oct
95
น้ํ
ามั
นดี
เซลหมุ
นเร็
ว...................................
7,068
2,335 2,300 2,433
Diesel oil high speed
วั
สดุ
ก
อสร
าง (พั
นตั
น)
Construction materials (thousand tons)
ซี
เมนต
ปอร
แลนด
......................................
7,460
2,368
2,357
2,735
Portland cement
ซี
เมนต
ผสม.................................................
1,553
544
492
517
Mixed cement
ปู
นเม็
ด.........................................................
10,126
3,570
3,383
3,173
Clinkers
เหล็
กและผลิ
ตภั
ณฑ
เหล็
ก (ตั
น)
Iron and steel products (ton)
เหล็
กเส
นข
ออ
อย........................................
332,865
101,616 132,406 98,843
Bar deformd bars
ท
อเหล็
กกล
า...............................................
168,563
47,625 66,134 54,804
Pipe/Tube steel pipe
เหล็
กแผ
นเคลื
อบสั
งกะสี
...........................
113,819
37,416 42,169 34,234
Galvanised sheets
ยานยนต
และอุ
ปกรณ
Vehicles and equipments
ยานยนต
(คั
น)...........................................
485,092
155,324 179,967 149,801
Motor vehicles (unit)
ยางรถยนต
(พั
นเส
น)...............................
24,866
8,604 8,719 7,542
Tyre (thousand units)
เครื่
องใช
ไฟฟ
า (พั
นเครื่
อง)
Electrical products (thousand units)
โทรทั
ศน
.....................................................
137
40
43
54
Television
เครื่
องปรั
บอากาศและคอมเพรสเซอร
...
5,623
1,797 2,110 1,716
Air conditioner and compressor
ผลิ
ตภั
ณฑ
เภสั
ชกรรม
Pharmaceuticals,
และเคมี
ภั
ณฑ
ต
างๆ (ตั
น).........................
9,620
3,244 3,209 3,167
Chemicals Products (ton)
ที่
มา: สํ
านั
กงานเศรษฐกิ
จอุ
ตสาหกรรม กระทรวงอุ
ตสาหกรรม
Source: The Office of Industrial Economics, Ministry of Industry
ธั
นวาคม
December
ไตรมาสที่
4
Quarter
4
พฤศจิ
กายน
November
ตุ
ลาคม
October
รายการ
Item
2560
(2017)
Industrial Statistics
53
p


