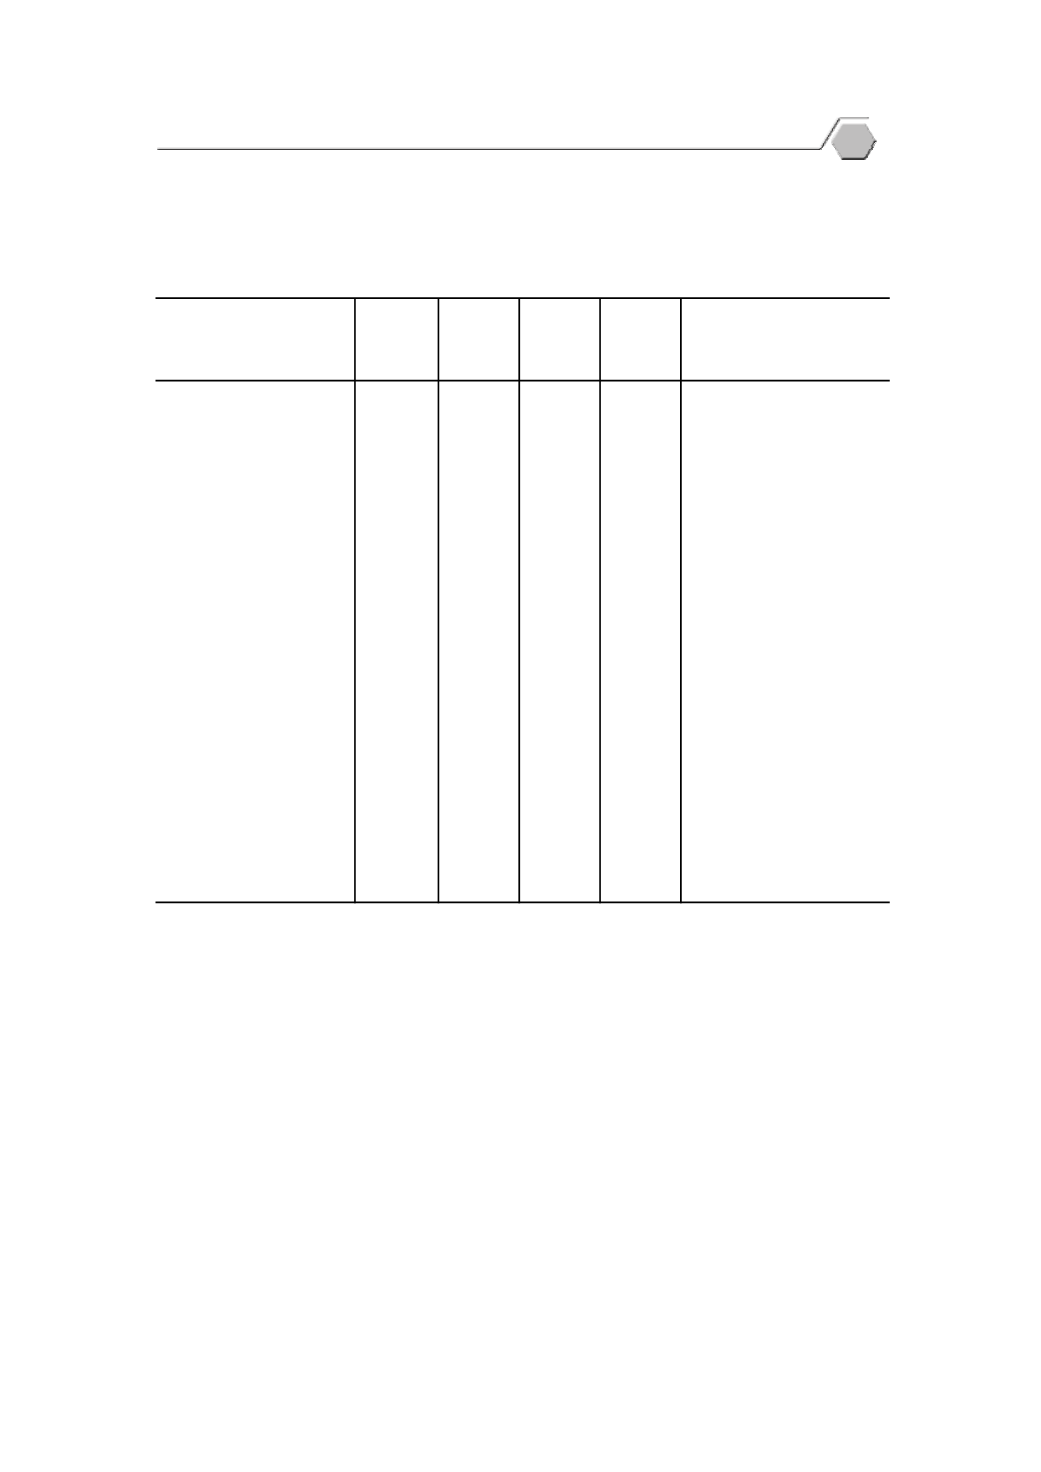
ตาราง
10.5
มู
ลค
าสิ
นค
าขาออก
10
อั
นดั
บแรกของไทย พ.ศ.
2561
Table
10.5
Top Ten Value of Exports of Thailand
: 2018
(ล
านบาท
Million Baht
)
ไตรมาสที่
1 ไตรมาสที่
2 ไตรมาสที่
3 ไตรมาสที่
4
Quarter
1
Quarter
2
Quarter
3
Quarter
4
รถยนต
อุ
ปกรณ
และส
วนประกอบ..........
230,316.0 224,698.4 245,447.8 227,598.1
Motor cars, parts and accessories
เครื่
องคอมพิ
วเตอร
อุ
ปกรณ
และส
วนประกอบ.......................
158,257.9 155,495.7 169,375.7 150,034.3
Computers, parts and accessories
ผลิ
ตภั
ณฑ
ยาง..............................................
82,149.4
87,362.8
90,080.2
93,922.7
Rubber products
อั
ญมณี
และเครื่
องประดั
บ..........................
101,696.3
96,325.7
93,497.4
92,193.8
Precious stones and jewellery
น้ํ
ามั
นสํ
าเร็
จรู
ป............................................
64,408.2
67,365.9
82,115.9
85,162.5
Refine
fuels
Polymers of ethylene, propylene,
เม็
ดพลาสติ
ก................................................
78,903.9
84,800.6
86,432.2
80,919.4
etc in primary forms
เคมี
ภั
ณฑ
.......................................................
70,220.4
72,261.6
73,571.0
78,203.2
Chemical products
แผงวงจรไฟฟ
า.............................................
65,603.4
66,358.8
69,760.9
65,385.6
Electronic
integrated
circuites
เครื่
องจั
กรกลและส
วนประกอบ
ของเครื่
องจั
กรกล....................................
67,163.0
62,871.6
68,376.2
64,419.7
Machinery and parts thereof
เหล็
ก
เหล็
กกล
าและผลิ
ตภั
ณฑ
..................
48,620.2
50,860.8
50,643.8
50,259.5
Iron,
steel
and
products
หมายเหตุ
: ตั
วเลขเบื้
องต
น
Note
:
Preliminary figure
.
ที่
มา: สํ
านั
กงานปลั
ดกระทรวงพาณิ
ชย
กระทรวงพาณิ
ชย
Source
:
Office of the Permanent Secretary, Ministry of Commerce
สิ
นค
า
Commodity
67
Trade and Price Statistics


