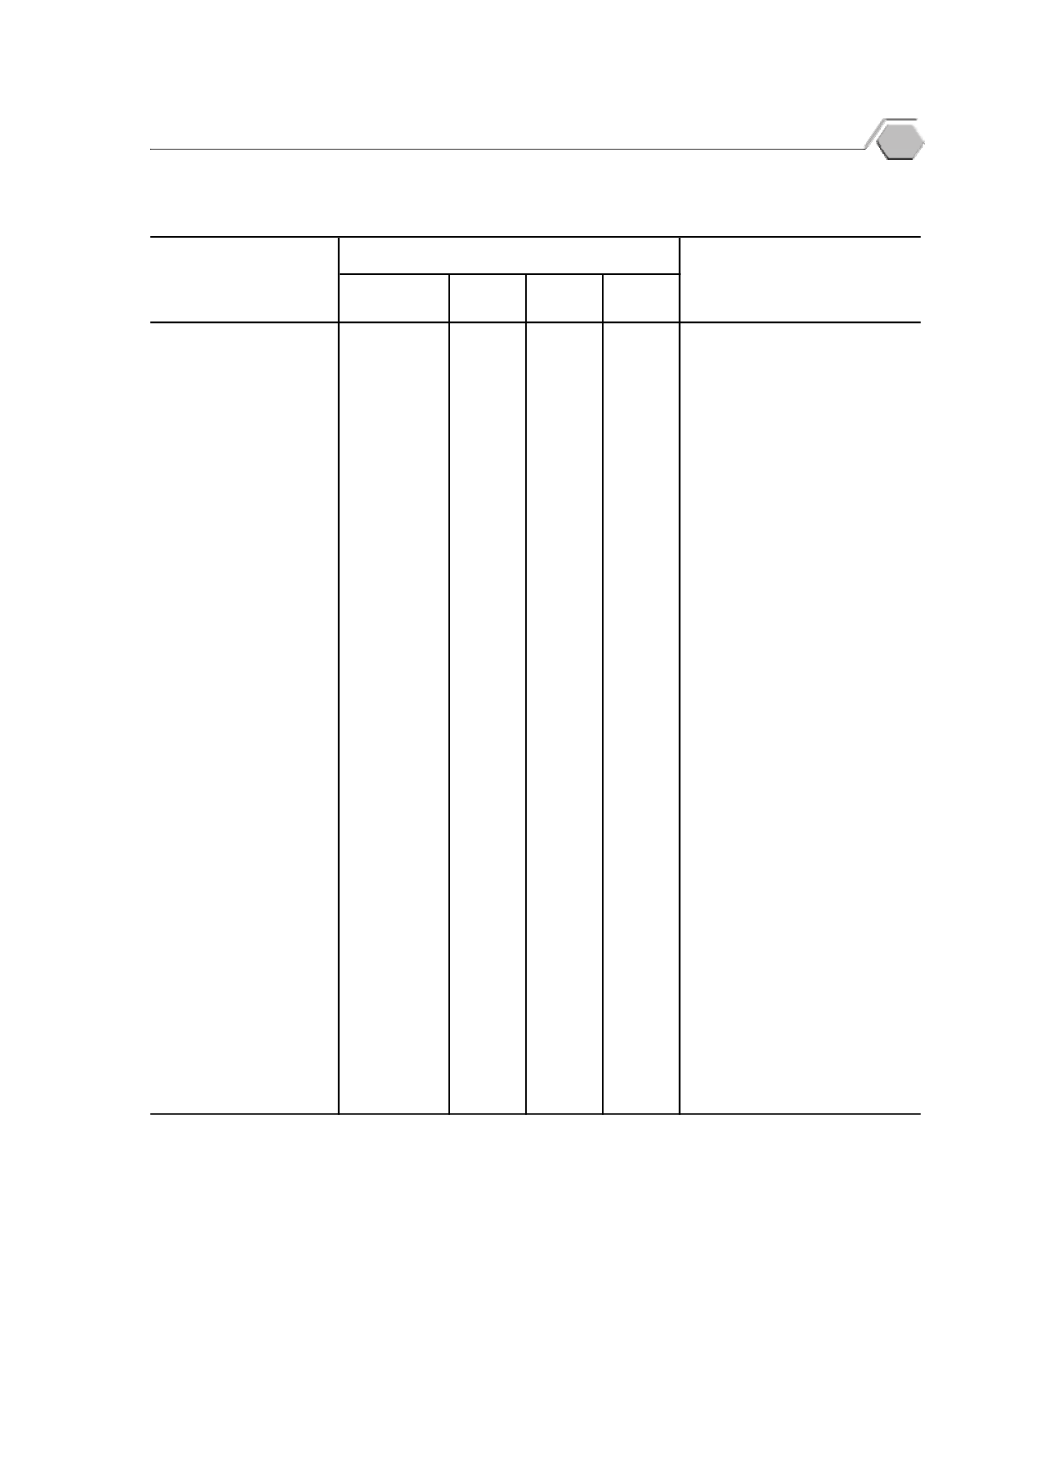
ตาราง
8.1
ผลผลิ
ตภาคอุ
ตสาหกรรม พ.ศ.
2561
Table
8.1
Production of Manufactured Goods
: 2018
ตุ
ลาคม
October
อาหาร (ตั
น)
Food (ton)
ผลไม
และผั
กกระป
อง...........................
206,091
61,427 78,719 65,945
Canned fruit and vegetable
อาหารทะเลแช
แข็
ง................................
40,585
13,308 14,392 12,885
Frozen seafood
เครื่
องดื่
ม (พั
นลิ
ตร)
Beverages (thousand litres)
เบี
ยร
......................................................
628,184
169,117 227,694 231,373
Beer
โซดาและน้ํ
าดื่
มต
างๆ...........................
1,062,573
330,997 355,500 376,076
Soda and drinking water
สิ่
งทอและผลิ
ตภั
ณฑ
สิ่
งทอ
Textiles and textile products
ผ
าทอ(ฝ
าย) (พั
นเมตร)......................
27,807
9,284 9,276 9,247
Cotton fabrics (thousand meters)
เสื้
อผ
าสํ
าเร็
จรู
ป (พั
นชิ้
น)....................
30,587
10,112 10,531 9,944
Garment (thousand pieces)
ผลิ
ตภั
ณฑ
ป
โตรเลี
ยม (ล
านลิ
ตร)
Petroleum products (million litres)
น้ํ
ามั
นเบนซิ
นออกเทน 91...................
450
144
153
153
Gas (unlead) oct
91
น้ํ
ามั
นเบนซิ
นออกเทน 95...................
500
175
152
173
Gas (unlead) oct
95
น้ํ
ามั
นดี
เซลหมุ
นเร็
ว.............................
8,092
2,726 2,668 2,698
Diesel oil high speed
วั
สดุ
ก
อสร
าง (พั
นตั
น)
Construction materials (thousand tons)
ซี
เมนต
ปอร
แลนด
.................................
7,235
2,334
2,311
2,590
Portland cement
ซี
เมนต
ผสม............................................
2,145
730
661
754
Mixed cement
ปู
นเม็
ด....................................................
9,681
3,584
2,520
3,577
Clinkers
เหล็
กและผลิ
ตภั
ณฑ
เหล็
ก (ตั
น)
Iron and steel products (ton)
เหล็
กแผ
นเคลื
อบสั
งกะสี
......................
98,983
35,670 42,373 20,940
Galvanised sheets
ท
อเหล็
กกล
า..........................................
153,011
50,866 59,084 43,061
Pipe/Tube steel pipe
เหล็
กเส
นข
ออ
อย...................................
267,760
100,086 90,415 77,259
Bar deformd bars
ยานยนต
และอุ
ปกรณ
Vehicles and equipments
ยานยนต
(คั
น)......................................
526,681
184,452 184,637 157,592
Motor vehicles (unit)
ยางรถยนต
(พั
นเส
น)..........................
23,554
8,215 8,151 7,188
Tyre (thousand units)
เครื่
องใช
ไฟฟ
า (พั
นเครื่
อง)
Electrical products (thousand units)
ตู
เย็
น ......................................................
1,288
466
448
374
Refrigerator
เครื่
องซั
กผ
า..........................................
1,199
412
410
377
Washing machine
เครื่
องปรั
บอากาศและคอมเพรสเซอ
6,122
2,002 2,161 1,959
Air conditioner and compressor
ผลิ
ตภั
ณฑ
เภสั
ชกรรม
Pharmaceuticals,
และเคมี
ภั
ณฑ
ต
างๆ (ตั
น)...................
11,407
3,789 3,592 4,026
Chemicals Products (ton)
ที่
มา: สํ
านั
กงานเศรษฐกิ
จอุ
ตสาหกรรม กระทรวงอุ
ตสาหกรรม
Source: The Office of Industrial Economics, Ministry of Industry
ธั
นวาคม
December
ไตรมาสที่
4
Quarter 4
พฤศจิ
กายน
November
รายการ
Item
2561
(2018)
Industrial Statistics
53
p


