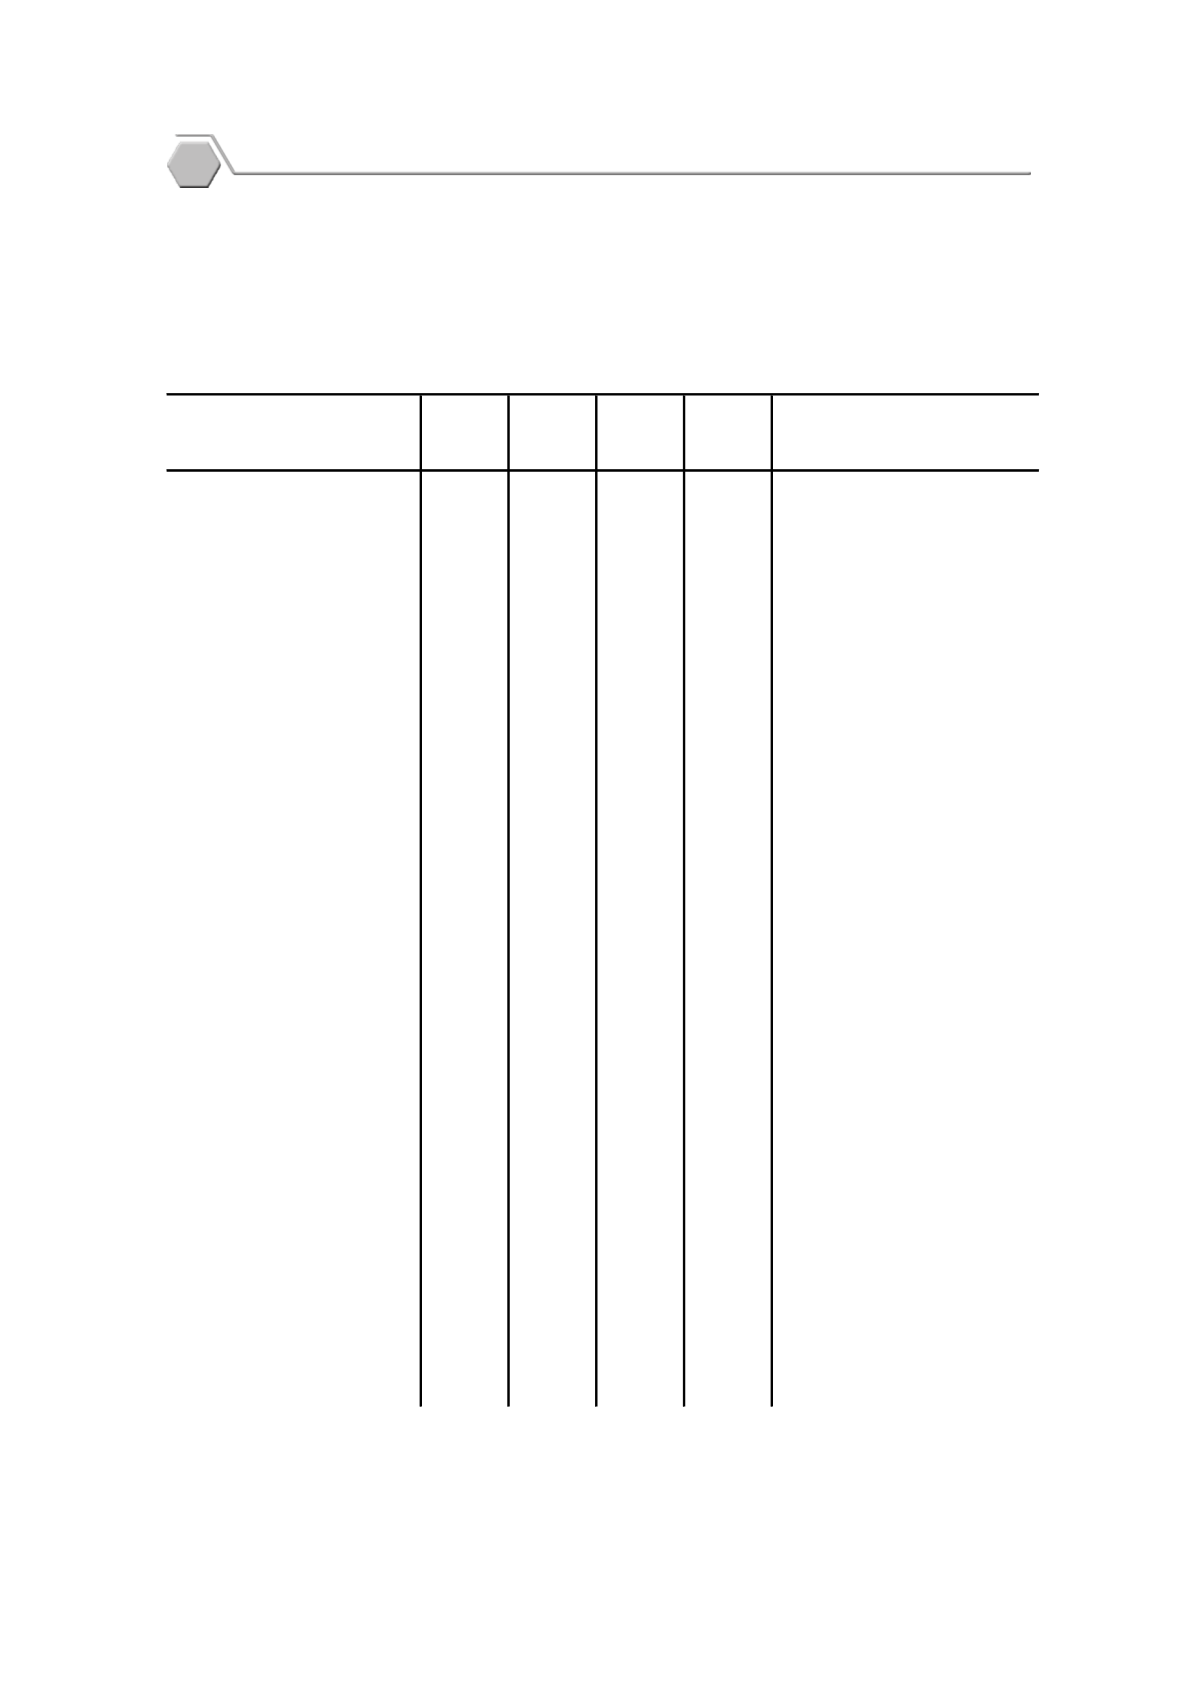
ตาราง
6.4
รายจ่
ายเพื่
อการอ ุ
ปโภคบริ
โภค แบบปริ
มาณล ู
กโซ่
(ปี
อ้
างอิ
ง พ.ศ.
2545
)
จาแนกตามประเภทรายจ่
าย พ.ศ.
2562
Table
6.4
Consumption Expenditure, Chain Volume Measures (Reference Year =
2002
)
by Type of Expenditure
: 2019
(ล้
านบาท
Million Baht
)
ไตรมาสที่
1 ไตรมาสที่
2 ไตรมาสที่
3 ไตรมาสที่
4
Quarter
1
Quarter
2
Quarter
3
Quarter
4
อาหารและเครื่
องดื่
มที่
ไม่
มี
แอลกอฮอล์
...................................
269,288
252,237
264,077
231,493
Food and non-alcoholic
เครื่
องดื่
มที่
มี
แอลกอฮอล์
ยาสู
บ
Alcoholic beverages, tobacco
และยาเสพติ
ด................................................................. 52,847
51,609
42,563
54,974
and narcotic
เสื้
อผ้
า และรองเท้
า.........................................................
70,423
73,986
73,912
92,469
Clothing and footwear
ที่
อยู
่
อาศั
ย ประปา ไฟฟ้
า ก๊
าซ
Housing, water, electricity, gas and
และเชื้
อเพลิ
งอื่
นๆ......................................................... 178,827
184,364
179,598
182,303
other fuels
เครื่
องเรื
อน เครื่
องใช้
และการบารุ
ง
Furnishings, households equipment and
. รั
กษาครั
วเรื
อน.............................................................. 89,468
84,002
82,924
84,423
routine maintenance of the house
การรั
กษาพยาบาล.................................................................97,814
96,294
96,921
96,428
Health
การขนส่
ง................................................................................221,129
230,183
217,542
219,398
Transport
การสื่
อสารและโทรคมนาคม........................................................
61,349
71,181
66,540
73,340
Communication
บั
นเทิ
งและนั
นทนาการ....................................................129,098
119,026
126,293
125,543
Recreation and culture
การศึ
กษา...................................................................
24,584
27,569
26,433
26,705
Education
ภั
ตตาคารและโรงแรม................................................
297,198
279,643
322,603
294,595
Restaurants and hotels
สิ
นค้
าและบริ
การเบ็
ตเตล็
ด............................................. 190,409
194,249
200,876
215,897
Miscellaneous goods and services
การใช้
จ่
ายเพื่
อการอ ุ
ปโภคบริ
โภค
Consumption expenditure
ของครั
วเรื
อน................................................................
1,649,091 1,620,343 1,663,660 1,639,611
of households
บวก: การใช้
จ่
ายเพื่
อการอุ
ปโภคบริ
โภคของ
Plus: Individual consumption expenditure
สถาบั
นไม่
แสวงหากาไรให้
บริ
การ
by non-profit institutions serving
ครั
วเรื
อน..........................................................................29,135
23,001
26,768
31,792
households (NPISHs)
การใช้
จ่
ายเพื่
อการอ ุ
ปโภคบริ
โภค
Private final consumption
ขั้
นส ุ
ดท้
ายของเอกชน ตลาดในประเทศ..… 1,678,192 1,643,402 1,690,437 1,671,323
expenditure in the domestic market
บวก: คนไทยใช้
จ่
ายในต่
างประเทศ…………………....................... 71,014
76,594
68,026
80,267
Plus: Expenditure of residents abroad
Less: Expenditure of non-residents
หั
ก: คนต่
างประเทศใช้
จ่
ายในประเทศไทย.............
386,920
278,988
327,288
355,084
in the country
รายจ่
ายเพื่
อการอ ุ
ปโภคบริ
โภคขั้
นส ุ
ดท้
าย
ของเอกชน….........................................................................
1,381,731 1,449,514 1,444,821 1,412,078
Private final consumption expenditure
ประเภทรายจ่
าย
Type of expenditure
บั
ญชี
ประชาชาติ
62
p


