Source: ASEAN Statistics,
/
Economic
Indicators
Thailand & ASEAN Key Indicators
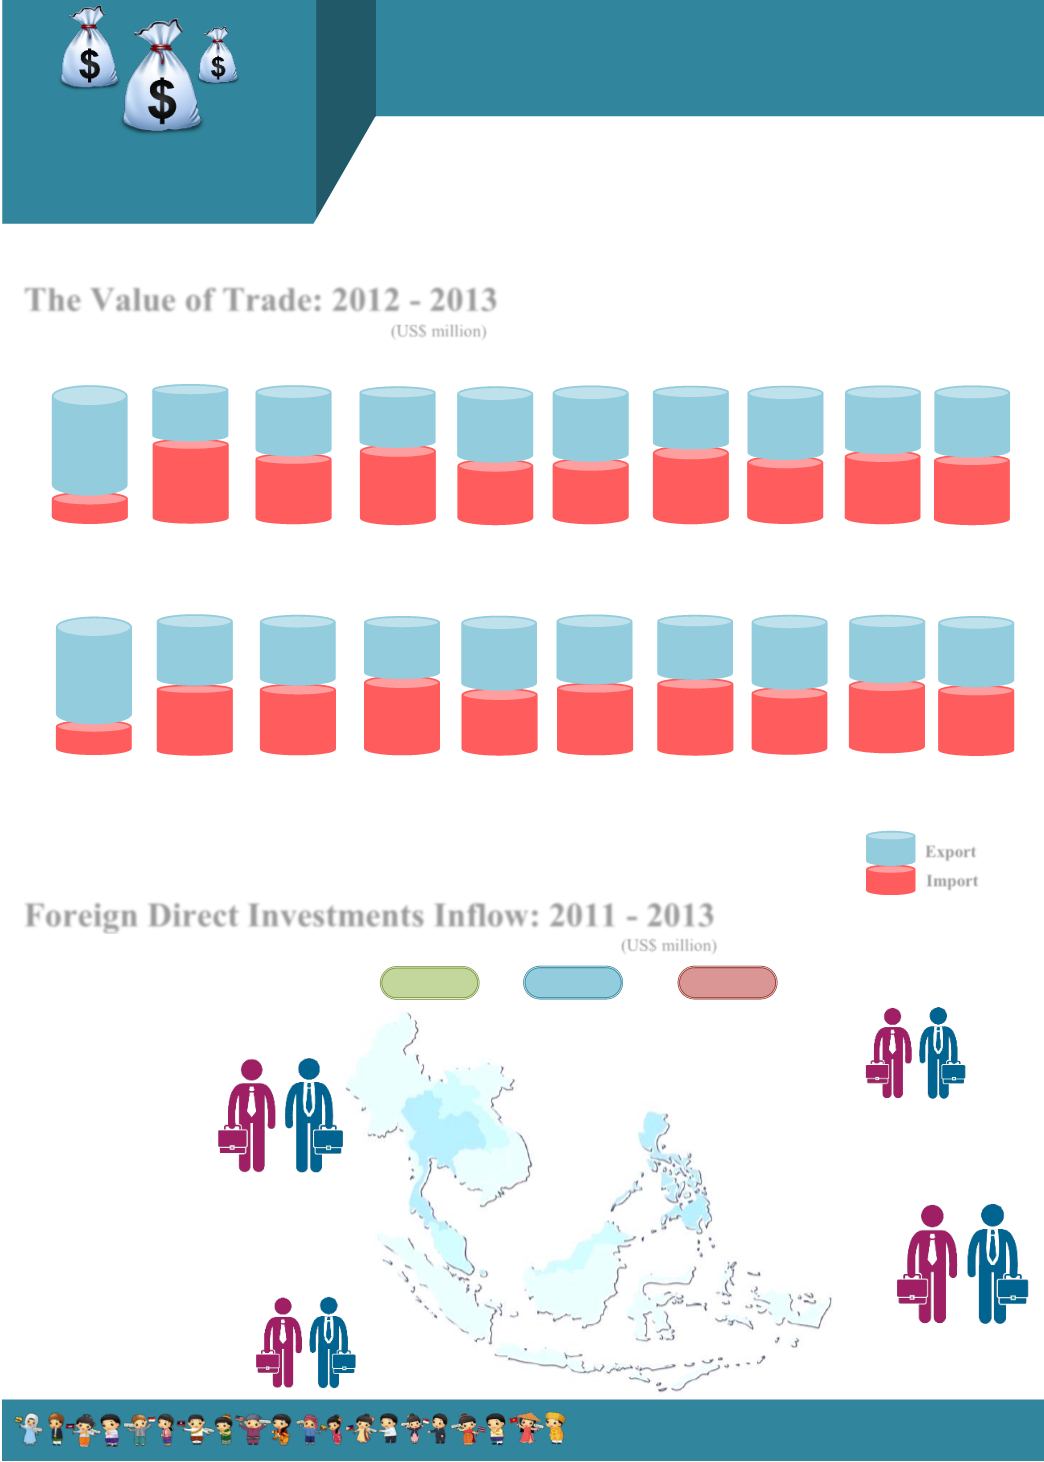
(US$ million)
The Value of Trade: 2012 - 2013
Foreign Direct Investments Inflow: 2011 - 2013
Brunei
Darussala
m
Cambodia
Indonesia
Lao PDR
Malaysia
Myanmar
Philippines
Singapore
Thailand
Viet Nam
2
0
1
2
2
0
1
3
Import
Export
78.2%
22.8%
16,856.3
39.8%
60.2%
49.8%
50.2%
43.1%
56.9%
53.6%
46.4%
53.5%
46.5%
44.3%
55.7%
51.8%
48.2%
48.1%
51.9%
50.3%
49.7%
18,663.7
381,721.3
6,158.7
424,002.8
14,035.7
117,381.6
790,758.9
477,301.9
227,793.2
76.0%
24.0%
15,057.2
49.9%
50.1%
49.4%
50.6%
44.1%
55.9%
52.6%
47.4%
48.8%
51.2%
45.3%
54.7%
52.4%
47.6%
47.8%
52.2%
50.1%
49.9%
18,324.2
369,180.5
5,884.9
434,261.6
23,445.4
119,108.9
783,265.5
478,247.3
264,774.0
(US$ million)
2011
2012
2013
Brunei Darussalam
Cambodia
Indonesia
Lao PDR
Malaysia
Myanmar
Philippines
Singapore
Thailand
Viet Nam
1,208.3
864.8
908.4
891.7
1,557.1
1,274.9
19,241.6
19,137.9
18,443.8
300.7
294.4
426.7
12,000.9
9,400.0
12,297.4
2,057.0
1,354.2
2,620.9
1,815.9
2,797.0
3,859.8
55,285.2
59,811.5
60,644.9
7,775.9
10,699.2
12,999.8
7,519.0
8,900.0
8,368.0


