มู
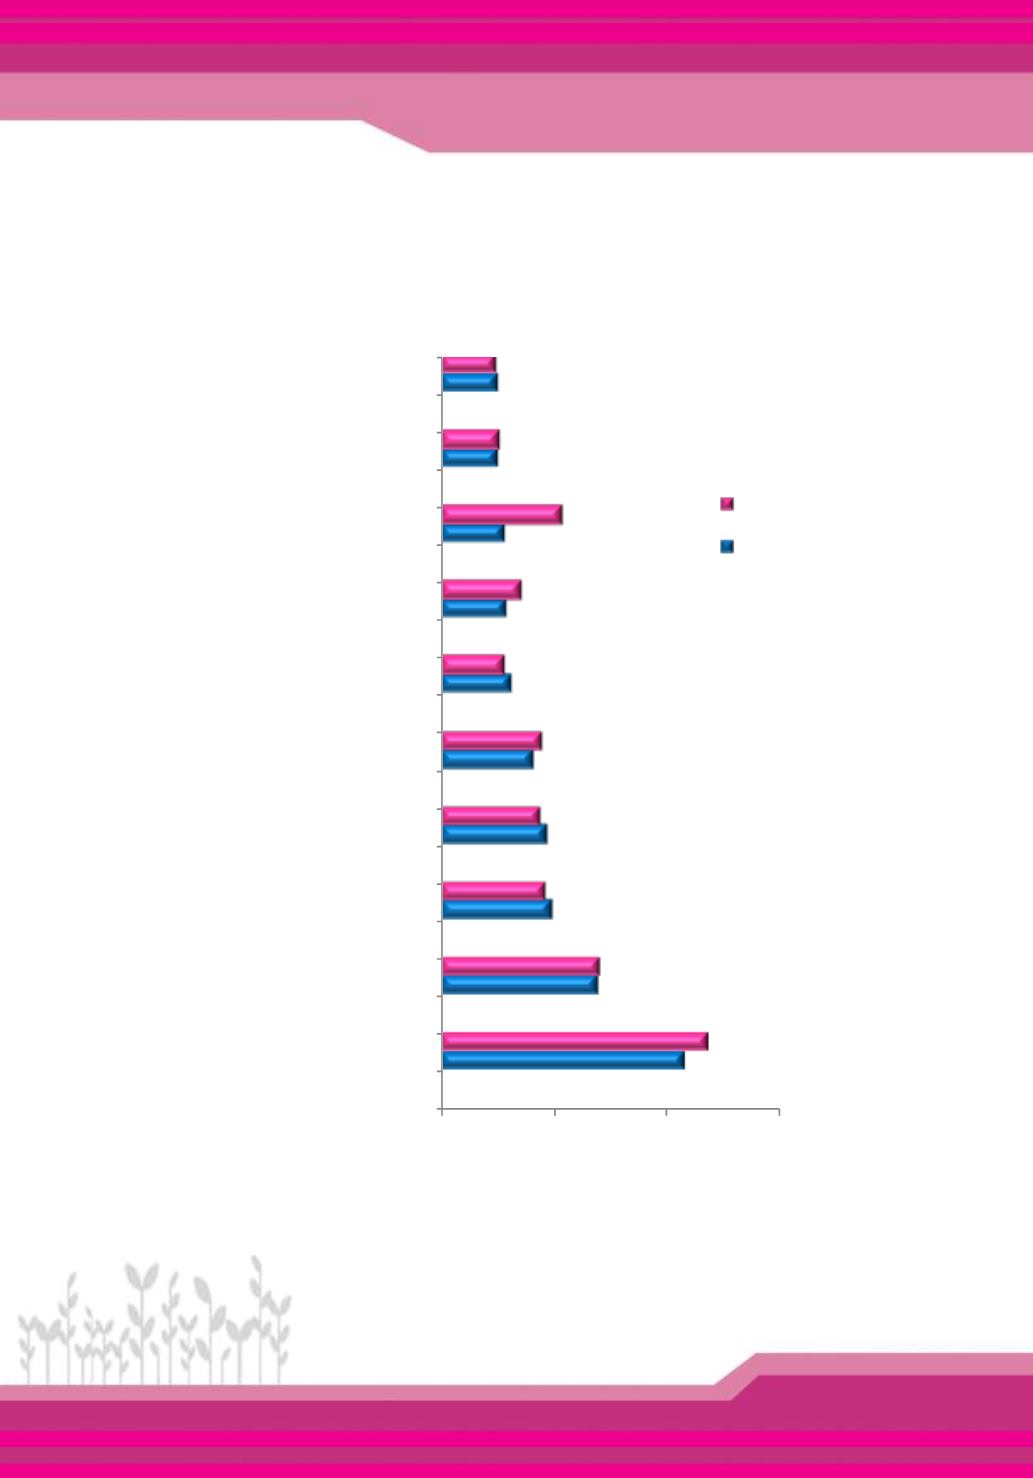
ลค่
าสิ
นค้
านาเข้
า 10 อั
นดั
บแรก พ.ศ. 2556 – 2557
Value of the Top Ten Imported Products: 2013 – 2014
1,079.6
695.1
497.1
472.3
416.1
315.0
294.7
287.8
257.0
-
255.8
1,190.4
709.4
464.2
439.8
452.1
282.0
363.9
540.0
260.0
245.7
0
500
1000
1500
Crude oil
ม
Machinery and parts thereof
ร ง
กรก แ ะส่
ระก
Electrical machinery and parts
ร ง
กร
แ ะส่
ระก
Chemical products
ม
ณ ์
Iron and steel products.
ห
ก ห
กก
แ ะ
ณ ์
Electronic integrated circuits
แ ง ง ร
Automotive parts and accessories
ส่
ระก แ ะ
กรณ์
ย ย ์
Jewellery including silver bars and gold
ร ง พ รพ ย
มณ ง แ ่
ง แ ะ ง
Automatic data processing machines parts…
ร ง มพ ร์
กรณ์
แ ะส่
ระก
Other metal waste and scrap
ส แร่
หะ
ศ หะแ ะ
ณ ์
2556/2013
2557/2014
พั
นล้
านบาท /
Billion Baht
สิ
นค้
านาเข้
า10 อั
นดั
บ / Top Ten Imported Products
ม : ส
กง
กระ ร งพ ณ ย์
กระ ร งพ ณ ย์
Source: Office of the Permanent Secretary of Ministry of Commerce, Ministry of Commerce.
19
ดั
ชนี
ราคา/การค้
าระหว่
างประเทศ
Price Index/International Trade


