การเงิ
น/การคลั
ง
Monetary/Public Finance
7
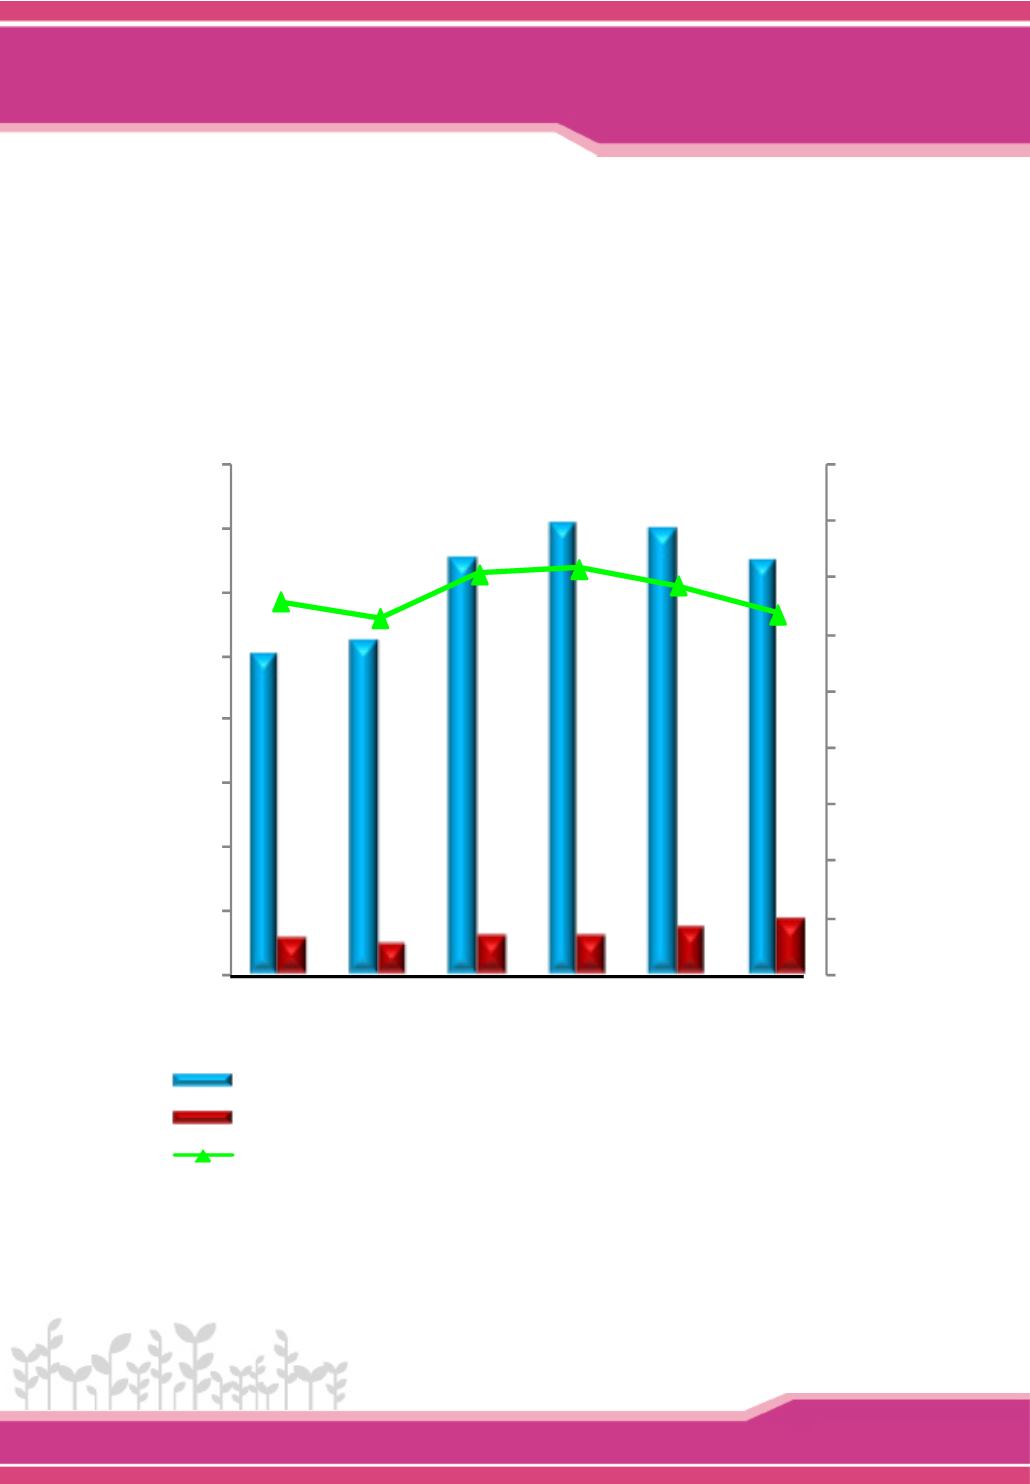
หนี้
ต่
างประเทศ ภาระการชำ
�ระหนี้
ต่
างประเทศ หนี้
ต่
างประเทศต่
อ GDP
พ.ศ. 2553 – 2558
External Debt, Debt Service Payments and External Debt per GDP:
2010 – 2015
0.00
5.00
10.00
15.00
20.00
25.00
30.00
35.00
40.00
45.00
0
20,000
40,000
60,000
80,000
100,000
120,000
140,000
160,000
หนี้
ต
างประเทศ External Debt
ภาระการชํ
าระหนี้
ต
างประเทศ Debt Service Payments
สั
ดส
วนหนี้
ต
างประเทศต
อ GDP : Proportion of External Debt per GDP
ล
านดอลลาร
สรอ./ Million USD
%
2553 2554 2555 2556 2557
p
2558
p
ปี
2010 2011 2012 2013 2014
p
2015
p
Year
100,561 104,334
130,747
141,933 140,135
129,398
10,542 9,038 11,698 11,421 13,841 16,843
32.97 31.49 35.35
35.82
34.38 31.81
หมายเหตุ
: 1/ ปรั
บปรุ
งตามวิ
ธี
ของธนาคารโลก โดยใช้
ค่
าเฉลี
่
ยรายปี
ของ GDP 3 ปี
ย้
อนหลั
ง
นั
บแต่
ไตรมาสที
่
พิ
จารณา
ที
่
มา: ธนาคารแห่
งประเทศไทย
Note 1/ The denominator has been adjusted to be compliant with the World Bank
method; i.e. calculated as a 3-year moving average GDP.
Source: Bank of Thailand.
หนี้
ต่
างประเทศ (External Debt)
ภาระก รชำ
�ระหนี้
ต่
างประเทศ (Debt Service Payments)
หนี้
ต่
างประเทศต่
อ GDP
1/
: (External Debt per GDP)
1/
100,561 104,334
130,747
141,933 140,135
129,398
32.97 31.49
35.35 35.82 34.38
31.81
0.00
5.00
10.00
15.00
20.00
25.00
30.00
35.00
40.00
45.00
0
20,000
40,0
60,000
80,000
100,0
120,000
140,000
160,000
หนี้
ต
างประเทศ (External Debt)
ภาระการชํ
าระหนี้
ต
างประเทศ (Debt Service Payments)
สั
ดส
วนหนี้
ต
างประเทศต
อ GDP : (Proportion of External Debt per GDP)
ล
านดอลลาร
สรอ./ Million USD
%
2553 2554 2555 2556 2557
p
2558
p
ป
201 2011 2012 2013 2014
p
2015
p
Year
ล้
านดอลลาร์
สรอ. Millions of US Dollars ร้
อยละ (%)


