100
Thai Economic Indicators 2019
หน้
า
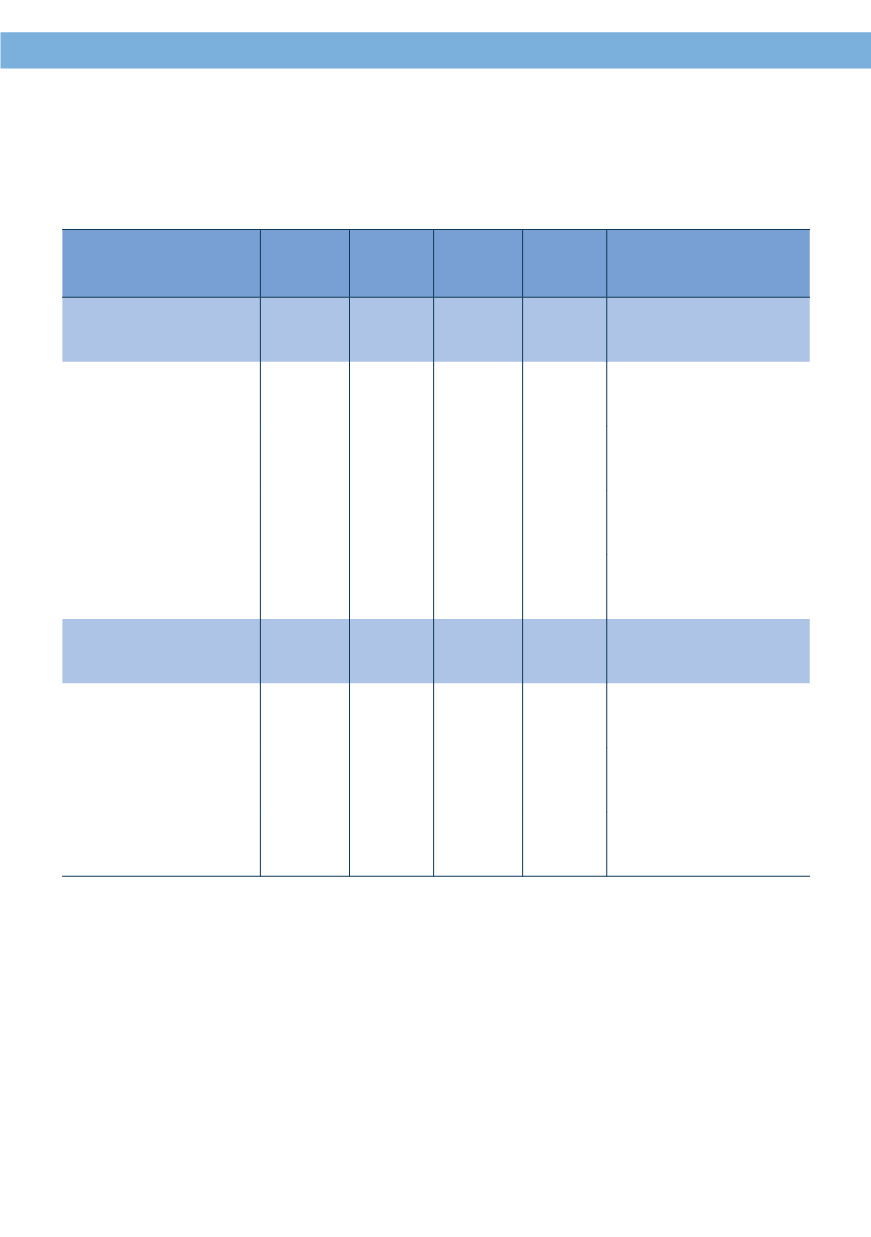
ตาราง 7.11 มู
ลค่
าพาณิ
ชย์
อิ
เล็
กทรอนิ
กส์
พ.ศ. 2558 - 2561
Table 7.11 Value of Electronic Commerce: 2015 - 2018
รายการ
2558
2015
2559
2016
2560
2017
2561
p
2018
p
Items
มู
ลค่
ารวมมู
ลค่
าการจั
ดซื้
อ
จั
ดจ้
างของภาครั
ฐ
2,245,147 2,560,103 2,762,503 3,150,233 e-Commerce value
Includes e-Auction
สั
ดส่
วน (ร้
อยละ)
100.0 100.0 100.0 100.0 Proportion (%)
ธุ
รกิ
จขายให้
กั
บผู้
บริ
โภค
22.7
27.5
27.5
27.5 Business to Consumer
(B2C)
ธุ
รกิ
จขายให้
กั
บธุ
รกิ
จ
59.5
60.2
54.6
54.4 Business to Business
(B2B)
ธุ
รกิ
จขายให้
กั
บภาครั
ฐ
17.8
12.3
17.9
18.2 Business to Government
(B2G)
มู
ลค่
าไม่
รวมรวมมู
ลค่
า
การจั
ดซื
้
อจั
ดจ้
างของภาครั
ฐ
1,844,808 2,245,499 2,267,034 2,577,941 e-Commerce value
Excludes e-Auction
สั
ดส่
วน (ร้
อยละ)
100.0 100.0 100.0 100.0 Proportion (%)
ธุ
รกิ
จขายให้
กั
บผู้
บริ
โภค
27.7
31.3
33.5
33.6 Business to Consumer
(B2C)
ธุ
รกิ
จขายให้
กั
บธุ
รกิ
จ
72.4
68.7
66.5
66.4 Business to Business
(B2B)
ที่
มา: สำ
านั
กงานพั
ฒนาธุ
รกรรมทางอิ
เล็
กทรอนิ
กส์
(องค์
การมหาชน) กระทรวงดิ
จิ
ทั
ลเพื่
อเศรษฐกิ
จและสั
งคม
Source: Electronic Transactions Development Agency (Public Organization), Ministry of Digital
Economy and Society
หน่
วย: ล้
านบาท (Unit: Milion Bath)


