176
หน้
า
Thai Economic Indicators 2019
รายการ
2558
r
2015
r
2559
r
2016
r
2560
r
2017
r
2561
p
2018
p
Items
รวม
107.42 113.78 119.63 121.98
Total
ภาคการเกษตร
125.78 134.16 130.64 129.33 Agriculture
เกษตรกรรม การล่
าสั
ตว์
และการป่
าไม้
126.10 133.82 129.31 128.46
Agriculture, Hunting and Forestry
การประมง
116.27 123.88 130.09 129.38
Fishing
นอกภาคการเกษตร
105.23 109.69 115.11 117.72 Non-Agriculture
เหมื
องแร่
เหมื
องหิ
น และอื่
นๆ
92.67 85.83 87.39 96.85
Mining Quarrying and Others
การผลิ
ต
101.28 108.72 114.56 113.17
Manufacturing
การไฟฟ้
า ก๊
าซ และประปา
99.61 91.36 98.01 116.88
Electricity, Gas and WaterSupply
การก่
อสร้
าง
120.49 127.95 125.82 123.93
Construction
การค้
าส่
ง ค้
าปลี
ก และ
การซ่
อมยานยนต์
109.07 113.91 123.25 130.45
Wholesale and Retail
Trade, Repair of Vehicles
โรงแรม และภั
ตตาคาร
113.63 119.78 130.64 137.65
Hotels and Restaurants
การขนส่
ง สถานที่
เก็
บสิ
นค้
า
และคมนาคม
108.25 112.65 116.82 122.02
Transport, storage and
Communication
การเงิ
นการธนาคาร
107.57 117.10 122.75 133.27
Financial Intermediation
การค้
าอสั
งหาริ
มทรั
พย์
ธุ
รกิ
จให้
เช่
าและธุ
รกิ
จอื่
นๆ
92.42 93.43 98.52 107.34
RealEstate, Renting and
Business Activities
การบริ
หารราชการแผ่
นดิ
น
100.44 107.59 108.80 100.95
Public Administration
การศึ
กษา
99.44 98.21 102.12 105.52
Education
การบริ
การสุ
ขภาพและ
สั
งคมสงเคราะห์
107.90 113.33 110.79 126.02
Health and Social Work
การบริ
การชุ
มชน สั
งคม
และส่
วนบุ
คคล
103.33 99.91 109.44 105.02
Other Community, Social and
Personal Service Activities
ลู
กจ้
างในครั
วเรื
อนส่
วนบุ
คคล
95.40 96.71 96.48 100.38
Private Household with
Employed Persons
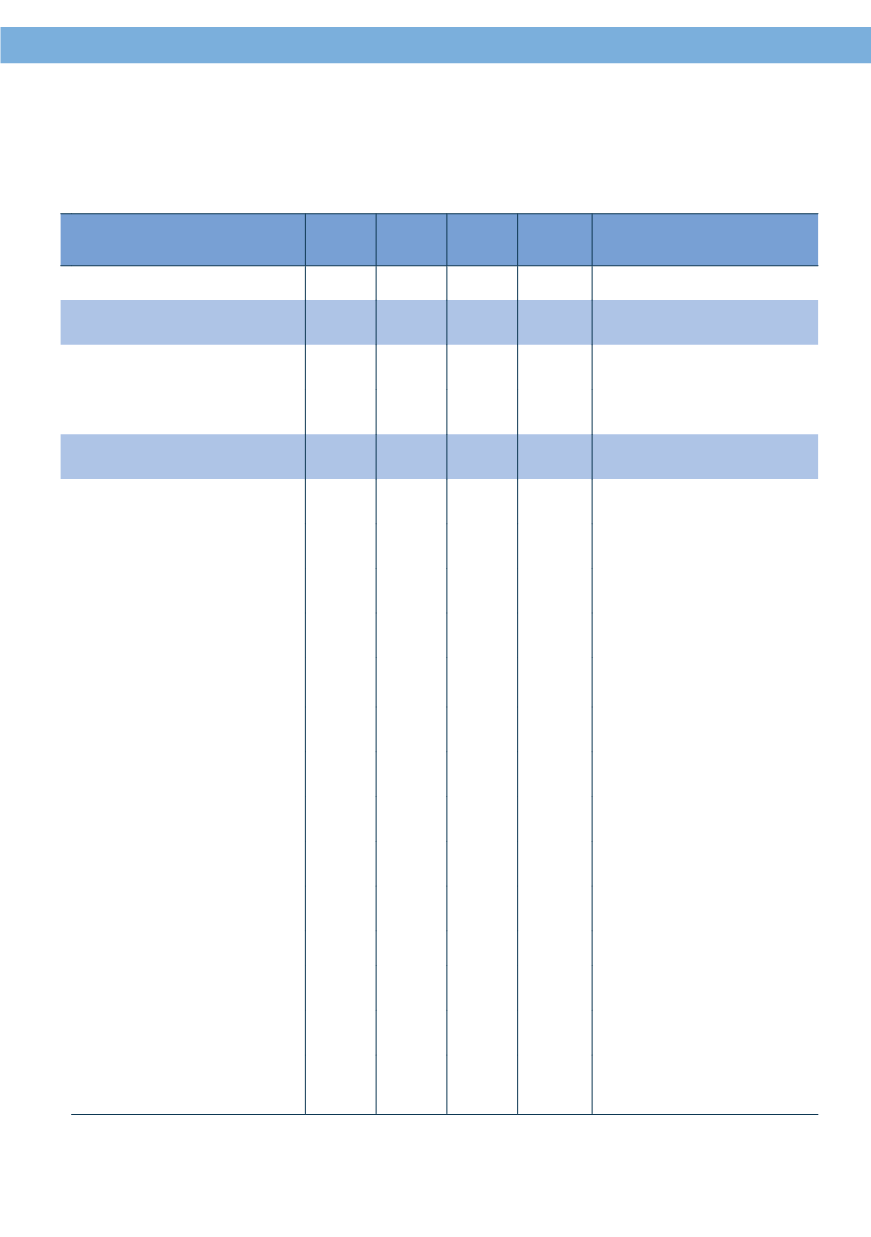
ตาราง 13.2 ดั
ชนี
ผลิ
ตภาพแรงงานต่
อคน พ.ศ. 2558 - 2561
Table 13.2 Labor Productivity Index per Employed Persons: 2015 - 2018
ที่
มา: ธนาคารแห่
งประเทศไทย
Source: Bank of Thailand
ข้
อมู
ล ณ ไตรมาส 4: Data as of Quarter 4


