8
ข้
อมู
ลพื้
นฐาน
Background Information
39.1
62.2
48.6
40.7
66.9
3.8
4.0
12.1
2.8
5.6
0.2
2.1
7.4
4.4
13.1
0.9
17.0
13.4
44.7
6.8
56.0
14.3
16.6
7.3
7.3
97.3
81.3
74.3
83.0
66.3
2.4
16.6
22.1
15.8
27.9
0.0
0.3
0.2
0.5
1.2
0.3
0.2
0.2
0.1
0.4
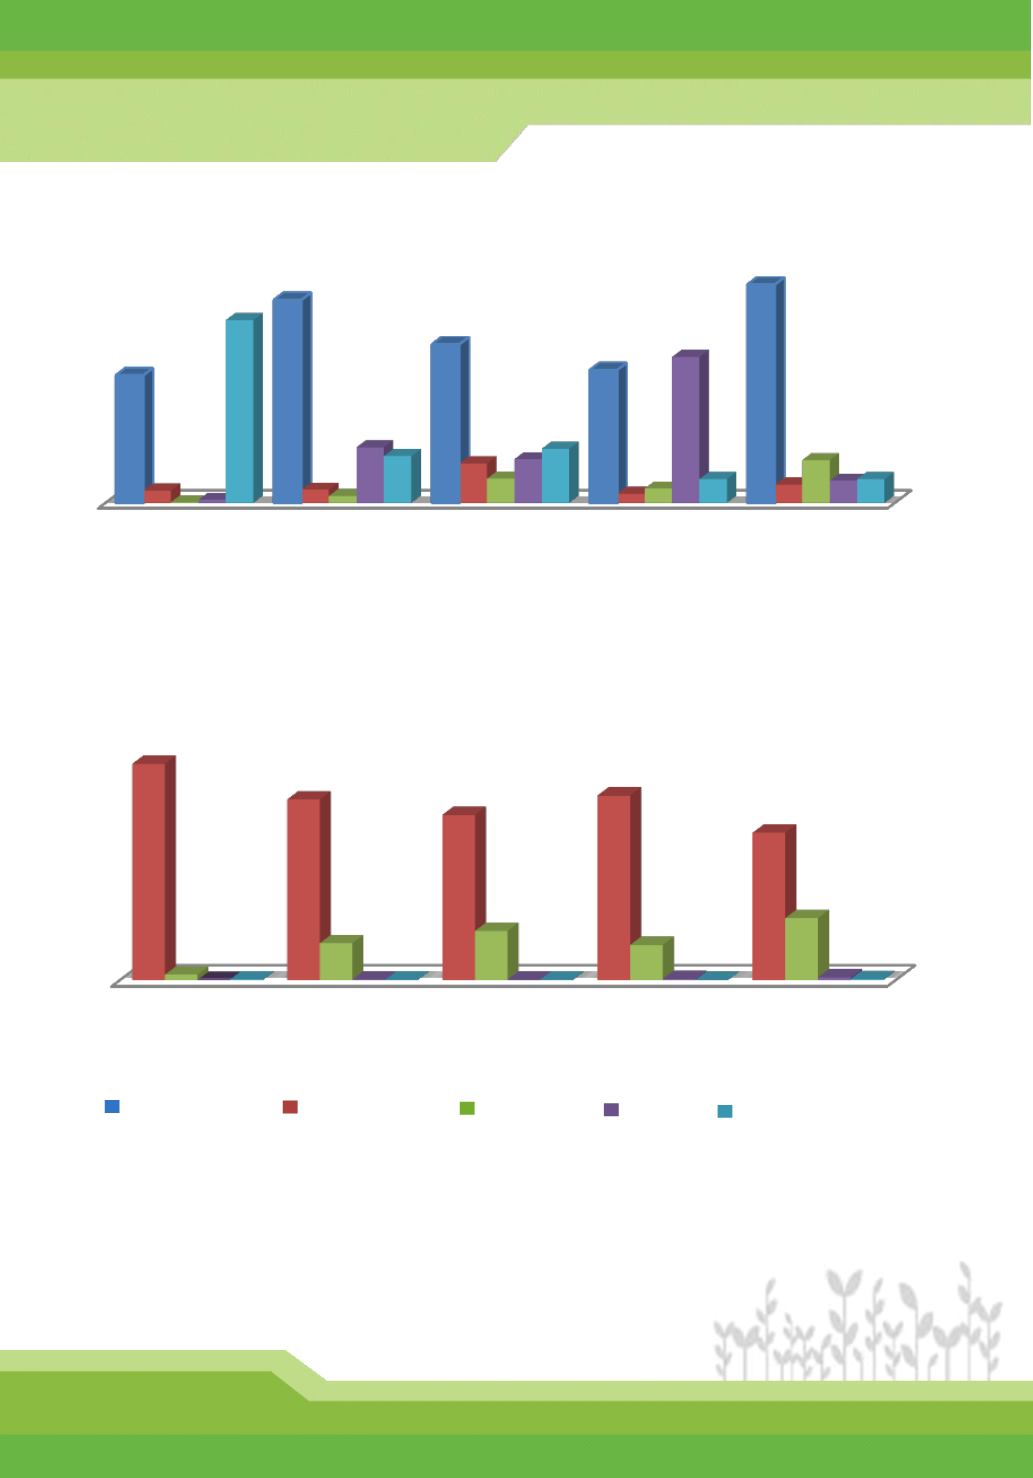
น้าดื่
มบรรจุ
ขวด/
ตู
้
น้
าดื่
มหยอดเหรียญ
Bottle-Water/
Water-Vending
Machine
น้าประปา
Piped Water-Supply
น้าบ่อ/บาดาล
Underground
Water
น้าฝน
Rain Water
น้าประปาผ่านการบาบั
ด
(ต้
มกรอง)
Tread Water Supply
(Boiling/Filtering)
ครั
วเรือนที่
เข้
าถึ
งแหล่
งน้
าใช้
สะอาด พ.ศ.2557 (รายภาค)
Household Accessing to Safe Water Supply 2014 (by Region)
ครั
วเรือนที่
เข้
าถึ
งแหล่
งน้
าดื่
มสะอาด พ.ศ.2557 (รายภาค)
Household Accessing to Safe Drinking Water 2014 (by Region)
หมายเหตุ
: 3 จั
งหวั
ดประกอบด้วย นนทบุ
รี
ปทุ
มธานี และสมุ
ทรปราการ
ที่
มา:
สานั
กงานสถิติแห่
งชาติ กระทรวงเทคโนโลยีสารสนเทศและการสื่
อสาร
Note:
3 Province Including Nonthaburi, PathumThani and SamutPrakan
Source: National Statistical Office, Ministry of Information and Communication Technology
กทม. และ 3 จั
งหวั
ด
Bangkok and
3 Province
ภาคกลาง
Central
ภาคเหนือ
Northern
ภาคตะวั
นออกเฉียงเหนือ
Northeastern
ภาคใต้
Southern
กทม. และ 3 จั
งหวั
ด
Bangkok and
3 Province
ภาคกลาง
Central
ภาคเหนือ
Northern
ภาคตะวั
นออกเฉียงเหนือ
Northeastern
ภาคใต้
Southern
หน่วย: ร้อยละ
Unit: percent
หน่วย: ร้อยละ
Unit: percent


