4
ประชากรและเคหะ
Population and Housing
1.8
2.0
2.4
2.7
2.3
2.5
2.6
2.8
2.9
2.7
2.3
1.9
1.5
1.0
2.2
0
1
2
3
4
2.0
2.1
2.5
2.5
2.3
2.5
2.6
2.7
2.7
2.6
2.2
1.7
1.3
0.9
1.7
4
3
2
1
0
1.8
1.9
2.0
2.1
2.3
2.3
2.1
2.2
2.4
2.5
2.5
2.3
1.9
1.5
2.3
4
3
2
1
0
1.7
1.8
1.9
2.1
2.2
2.3
2.2
2.3
2.6
2.7
2.8
2.6
2.2
1.7
3.1
0
1
2
3
4
ปิ
รามิ
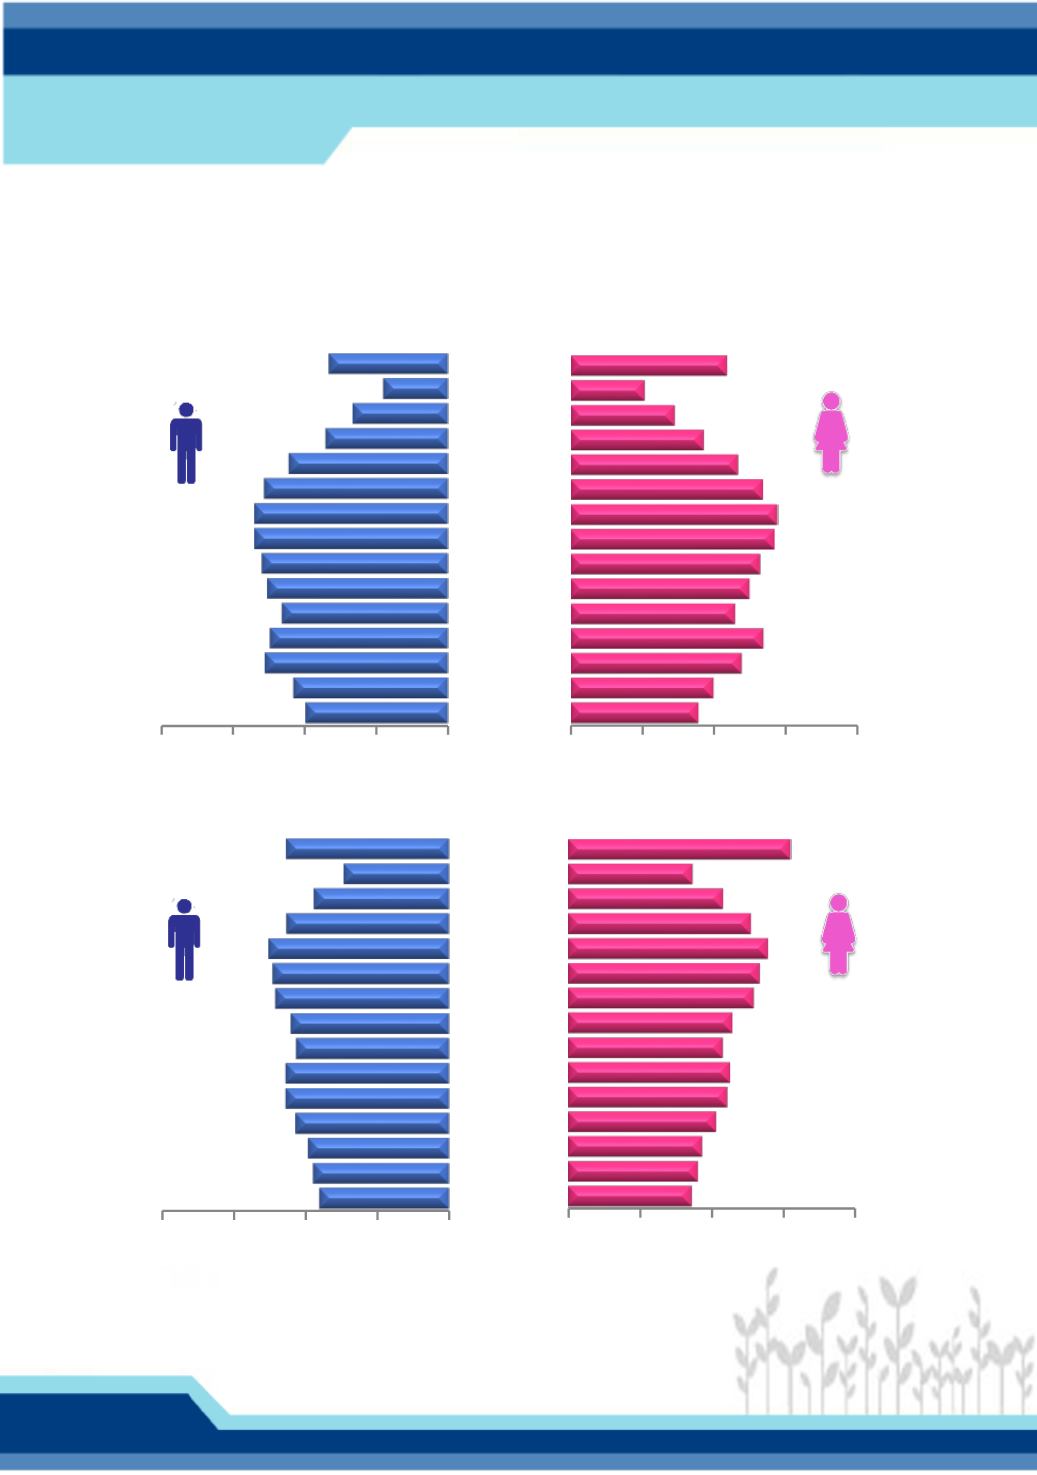
ดประชากรของประเทศไทย พ.ศ. 2553 2563 2573 และ 2583
Population Pyramid of Thailand : 2010 2020 2030 and 2040
ล้
านคน / Million persons
70+
65
-
69
60
-
64
55
-
59
50
-
54
45
-
49
40
-
44
35
-
39
30
-
34
25
-
29
20
-
24
15
-
19
10
-
14
5
-
9
0
-
4
2553 / 2010
2563 / 2020
70+
65
-
69
60
-
64
55
-
59
50
-
54
45
-
49
40
-
44
35
-
39
30
-
34
25
-
29
20
-
24
15
-
19
10
-
14
5
-
9
0
-
4
ล้
านคน / Million persons
กลุ่
มอายุ
/ Age group
กลุ่
มอายุ
/ Age group


