25
แรงงาน
Labor Force
0
20
40
60
80
100
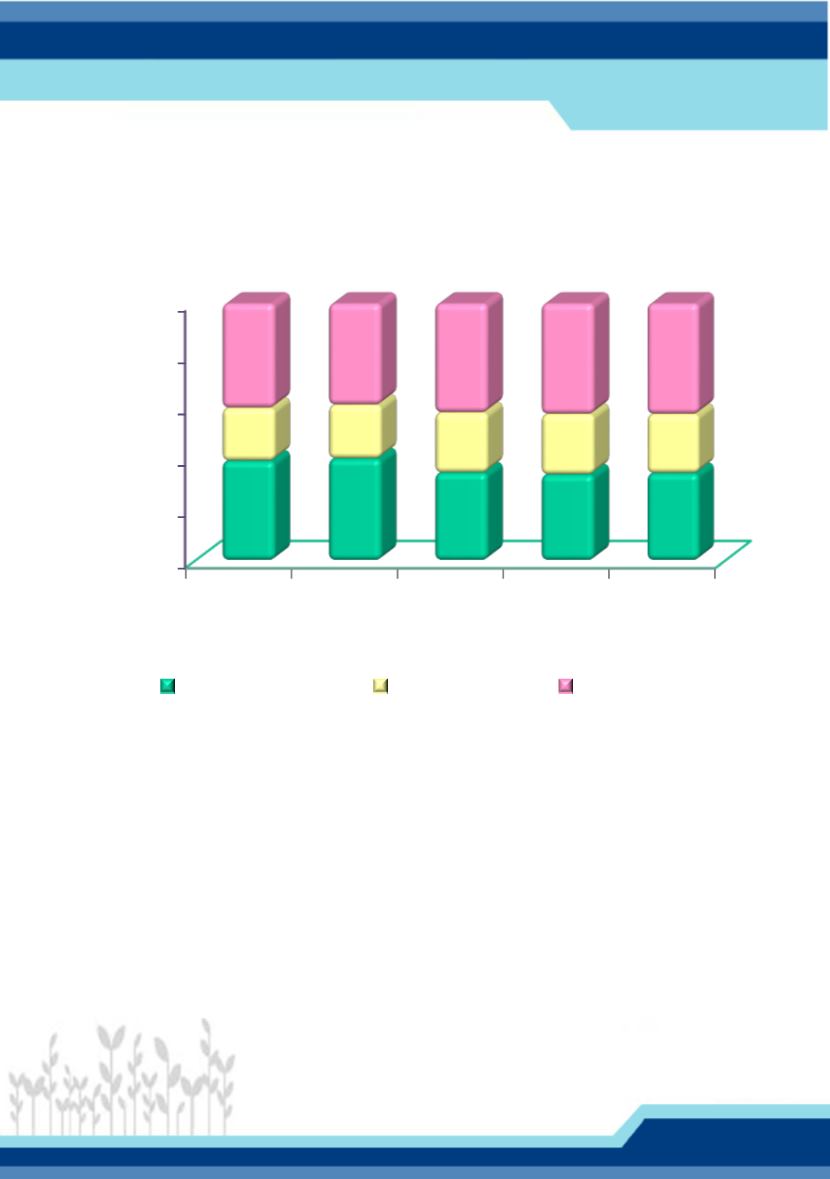
38.7
39.6
34.1
33.4
33.9
20.6
20.9
23.4
23.5
23.0
40.7
39.5
42.5
43.1
43.1
ภาคเกษตรกรรม
ภาคการผลิ
ต
ภาคบริ
การและการค้
า
ผู้
มี
งานทา จาแนกตามอุ
ตสาหกรรม พ.ศ. 2554 - 2558
Employed Persons by Industry : 2011 - 2015
หมำยเหตุ
: ตั้
งแต่
ไตรมำส 1 พ.ศ. 2554 มี
กำรปรั
บปรุ
งกำรจั
ดจำแนกประเภทอุ
ตสำหกรรม
โดยใช้
ตำม Thailand Standard Industrial Classification, (TSIC 2009)
Note: Since Round 1: 2011, The Survey has used the Third Revision of the
Thailand Standard Industrial Classification, (TSIC 2009).
ที่
มำ: กำรสำรวจภำวะกำรทำงำนของประชำกร พ.ศ. 2554 - 2558 สำนั
กงำนสถิ
ติ
แห่
งชำติ
Source: The Labor Force Survey : 2011 - 2015, National Statistical Office.
%
Agricultural Sector Manufacturing Sector Services and Trade Sector
2554 2555 2556 2557 2558 ปี
2011 2012 2013 2014 2015 Year


