Î
µÂµ¤
´Ê
°µ¦¨·
¡.«.
2562 - 2563
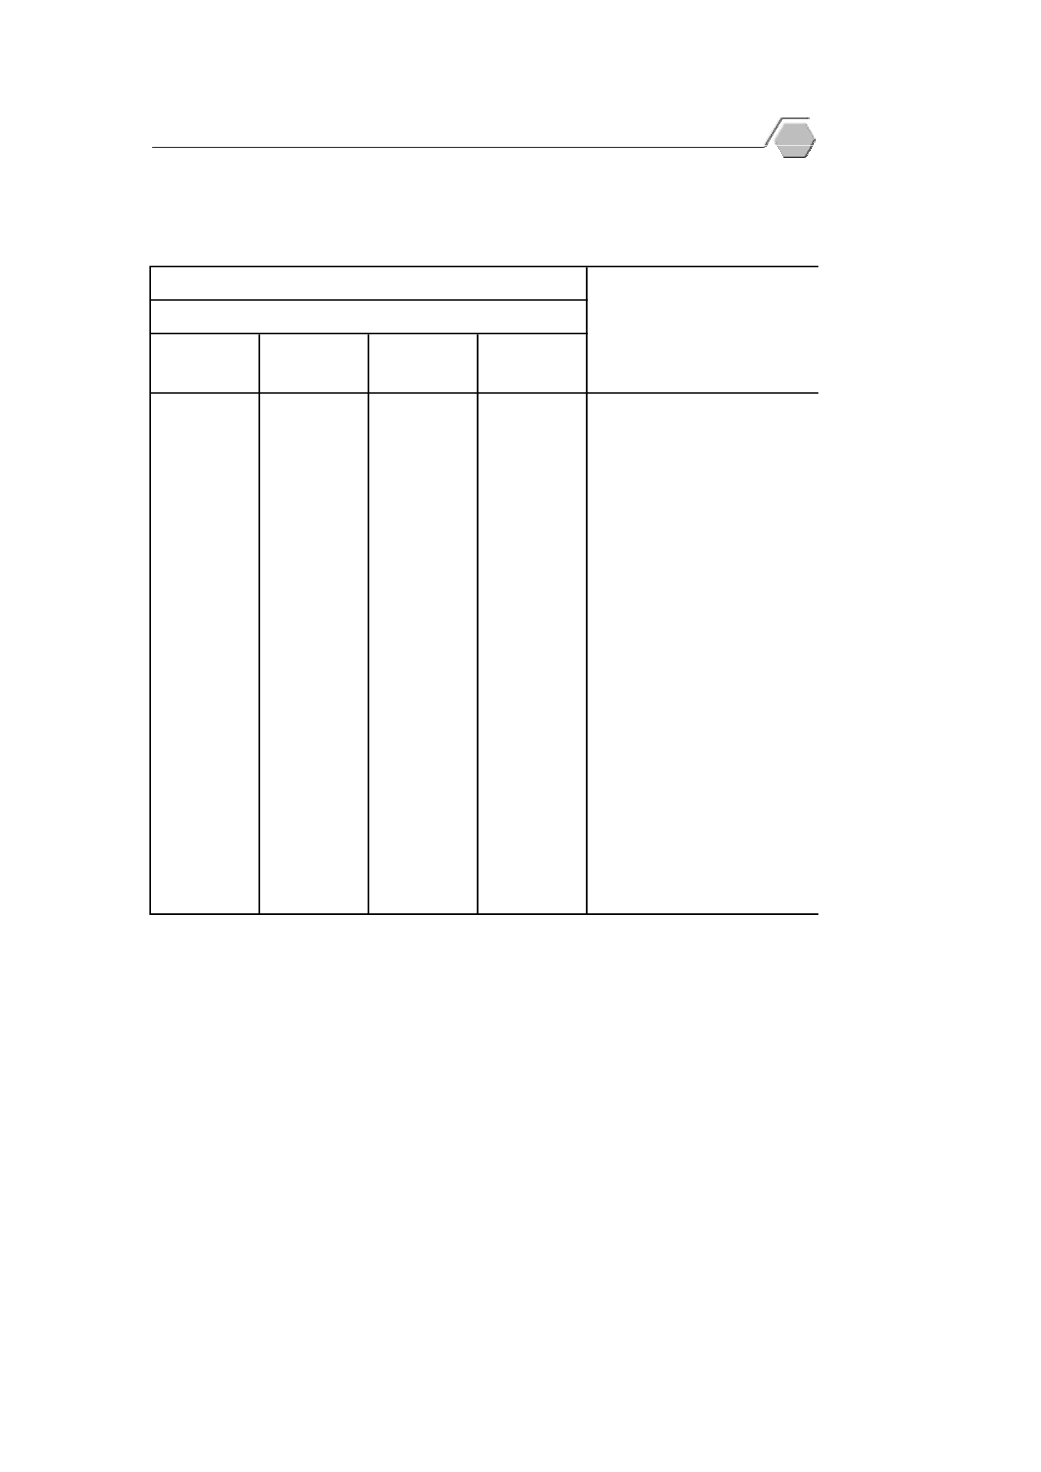
by Stage of Processing
: 2019 - 2020
[2553 (2010) = 100]
´
¸
¦ª¤
¤¦µ¤
»
¤£µ¡´
r
¤¸
µ¤
All items
January
February
March
102.6
102.8
102.8
102.2
Finished goods
106.2
106.6
106.6
105.5
Finished consumer goods
109.7
109.8
109.8
109.5
Consumer goods
Finished consumer
105.0
105.5
105.5
103.9
goods excluding foods
94.1
93.9
94.0
94.5
Capital equipments
97.6
99.3
98.2
95.2
Intermediate materials goods
96.7
98.9
97.5
93.7
Intermediate materials for industries
111.9
111.2
112.3
112.1
Intermediate foods and feeds
94.2
96.9
95.0
90.6
Intermediate materials less foods
99.6
99.7
99.6
99.5
Intermediate construction goods
99.3
99.8
99.4
98.8
Crude materials
119.7
120.1
119.7
119.3
Crude materials for foods
76.2
76.8
76.3
75.6
Crude non-food materials
Source: Office of Policy and Strategic Trade, Ministry of Commerce
2563 (2020)
Stage of processing
Ŧ¤µ¸É
1
Quarter
1
107
Trade and Price Statistics


