Î
µÂµ¤·
¦¦¤µ¦¨·
¡.«.
2562 - 2563
by Classification of Products Activities
: 2019 - 2020
´
¸
¦ª¤
¤¦µ¤
»
¤£µ¡´
r
¤¸
µ¤
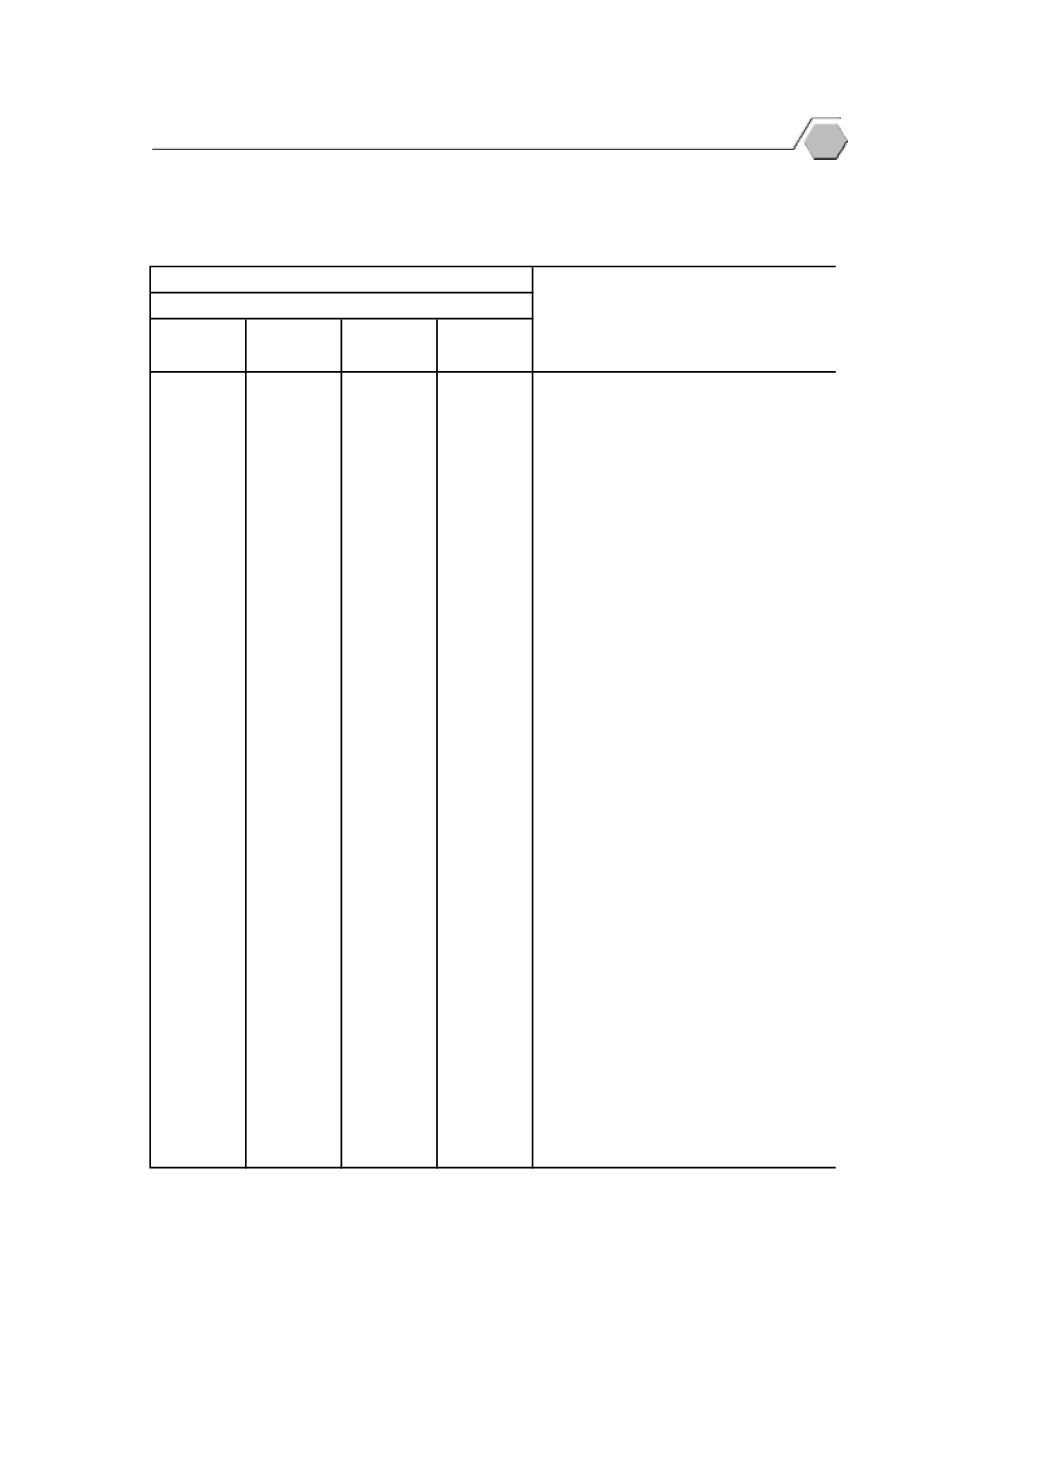
All items
January
February
March
100.9
101.6
101.2
100.0
105.4
105.9
105.6
104.8
Products of agriculture
103.0
103.2
103.2
102.5
Crops, livestock and forest products
139.0
141.9
138.9
136.3
Fish and other fishing products
111.8
112.8
111.9
110.7
Mining products
107.9
109.0
108.0
106.6
Lignite, petroleum & natural gas
124.0
124.1
124.0
123.8
Metal ores and other mining
100.5
101.2
100.9
99.5
Manufactured products
109.0
108.7
109.0
109.2
Food products, beverages & tobacco
107.2
107.1
107.2
107.3
Textiles and textiles products
104.7
104.7
104.7
104.8
Leather, leather products and footwears
103.7
103.7
103.8
103.7
Wood and wood products
104.2
104.5
104.0
104.1
Pulp, paper, paper products and printing
89.6
99.0
92.9
76.8
Petroleum products
95.9
95.1
96.1
96.5
Chemicals, chemical products
79.9
79.9
79.9
79.8
Rubber and plastic products
102.3
102.3
102.3
102.3
Non metallic mineral products
96.7
96.8
96.7
96.7
Basic metals and fabricated metal products
107.3
107.3
107.3
107.3
Machinery and equipment N.E.C.
90.6
90.4
90.4
90.9
Electrical equipment N.E.C.
105.5
105.5
105.5
105.5
Transport equipments
119.4
117.4
119.9
121.0
Other manufactured goods
Source: Office of Policy and Strategic Trade, Ministry of Commerce
Total Index
[2553 (2010) = 100]
2563 (2020)
Classification of products activities
Ŧ¤µ¸É
1
Quarter
1
109
Trade and Price Statistics


