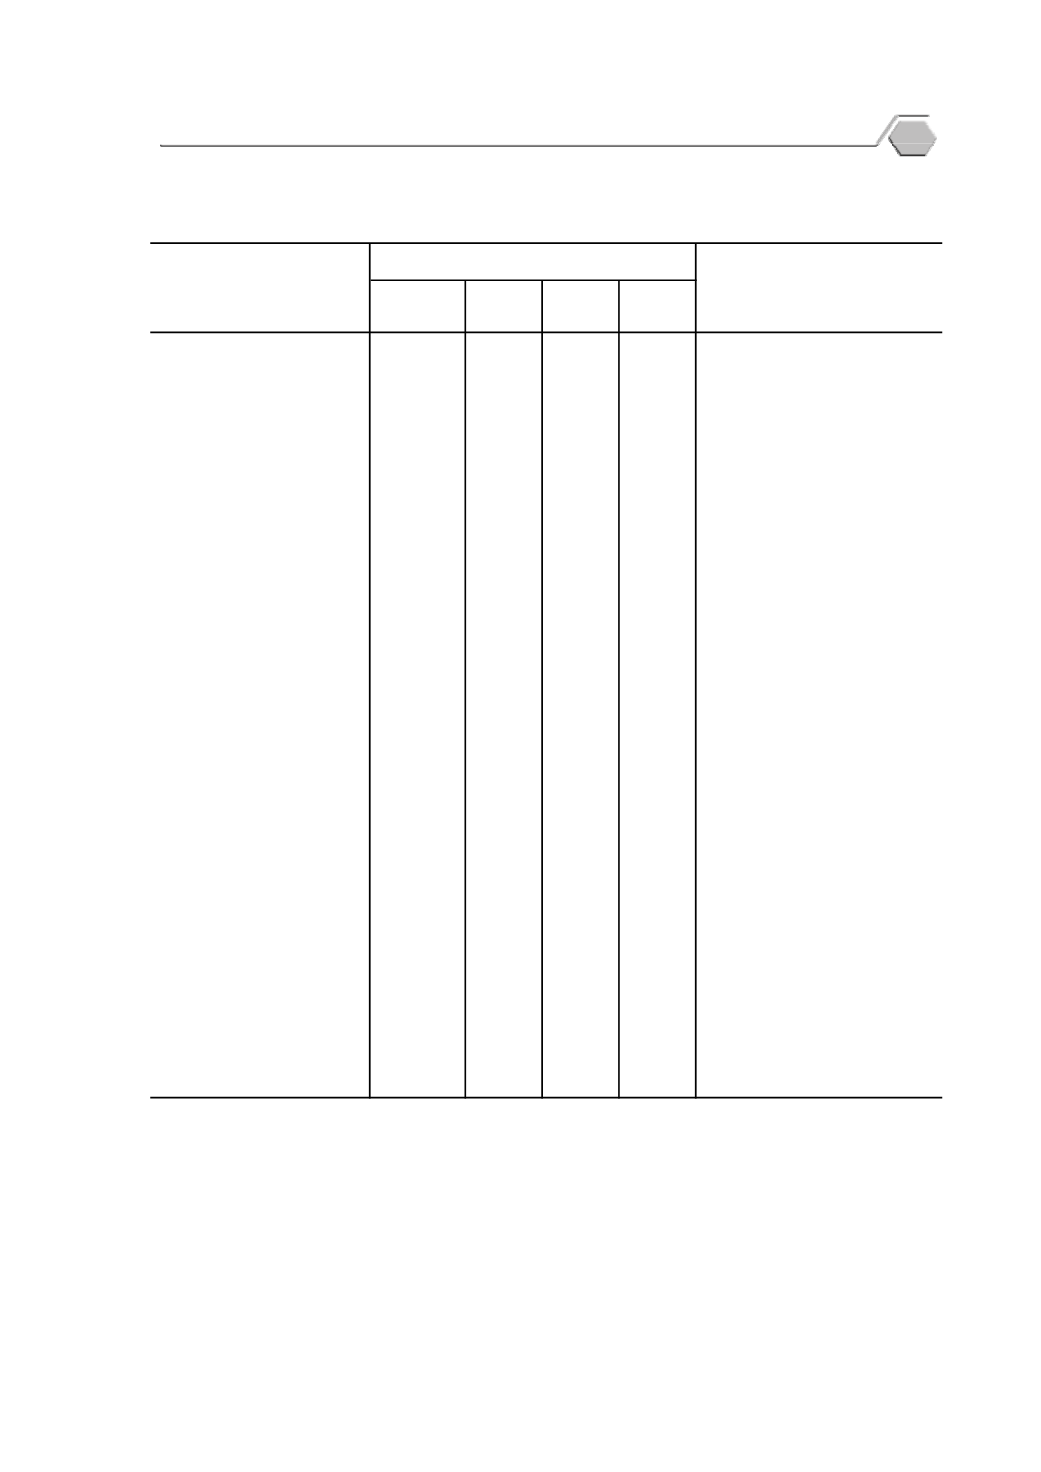
ตาราง
8.1
ผลผลิ
ตภาคอุ
ตสาหกรรม พ.ศ.
2560
Table
8.1
Production of Manufactured Goods
: 2017
อาหาร (ตั
น)
Food (ton)
ผลไม
และผั
กกระป
อง....................................
136,649
55,188 28,381 53,080
Canned fruit and vegetable
อาหารทะเลแช
แข็
ง.........................................
47,964
16,284 15,302 16,378
Frozen seafood
เครื่
องดื่
ม (พั
นลิ
ตร)
Beverages (thousand litres)
เบี
ยร
...............................................................
601,380
190,718 258,693 151,969
Beer
โซดาและน้ํ
าดื่
มต
างๆ....................................
969,496
313,204 323,388 332,904
Soda and drinking water
สิ่
งทอและผลิ
ตภั
ณฑ
สิ่
งทอ
Textiles and textile products
ผ
าทอ(ฝ
าย) (พั
นเมตร)...............................
27,861
9,036 9,091 9,734
Cotton fabrics (thousand meters)
เสื้
อผ
าสํ
าเร็
จรู
ป (พั
นชิ้
น).............................
28,306
9,224 9,818 9,264
Garment (thousand pieces)
ผลิ
ตภั
ณฑ
ป
โตรเลี
ยม (ล
านลิ
ตร)
Petroleum products (million litres)
น้ํ
ามั
นเบนซิ
นออกเทน 91............................
590
175
193
221
Gas (unlead) oct
91
น้ํ
ามั
นเบนซิ
นออกเทน 95............................
541
202
178
161
Gas (unlead) oct
95
น้ํ
ามั
นดี
เซลหมุ
นเร็
ว......................................
7,209
2,384 2,481 2,343
Diesel oil high speed
วั
สดุ
ก
อสร
าง (พั
นตั
น)
Construction materials (thousand tons)
ซี
เมนต
ปอร
แลนด
..........................................
7,579
2,755
2,316
2,508
Portland cement
ซี
เมนต
ผสม....................................................
1,783
569
583
632
Mixed cement
ปู
นเม็
ด.............................................................
10,362
3,260
3,473
3,629
Clinkers
เหล็
กและผลิ
ตภั
ณฑ
เหล็
ก (ตั
น)
Iron and steel products (ton)
เหล็
กเส
นข
ออ
อย............................................
384,988
130,024 121,740 133,224
Bar deformd bars
ท
อเหล็
กกล
า...................................................
190,819
60,160 67,635 63,024
Pipe/Tube steel pipe
เหล็
กแผ
นเคลื
อบสั
งกะสี
...............................
123,915
43,804 33,249 46,861
Galvanised sheets
ยานยนต
และอุ
ปกรณ
Vehicles and equipments
ยานยนต
(คั
น)...............................................
489,877
149,165 164,485 176,227
Motor vehicles (unit)
ยางรถยนต
(พั
นเส
น)..................................
26,060
8,810 8,432 8,818
Tyre (thousand units)
เครื่
องใช
ไฟฟ
า (พั
นเครื่
อง)
Electrical products (thousand units)
โทรทั
ศน
.........................................................
128
38
52
38
Television
เครื่
องปรั
บอากาศและคอมเพรสเซอร
......
5,704
1,978 1,873 1,853
Air conditioner and compressor
ผลิ
ตภั
ณฑ
เภสั
ชกรรม
Pharmaceuticals,
และเคมี
ภั
ณฑ
ต
างๆ (ตั
น)............................
9,515
3,036 3,175 3,305
Chemicals Products (ton)
ที่
มา: สํ
านั
กงานเศรษฐกิ
จอุ
ตสาหกรรม กระทรวงอุ
ตสาหกรรม
Source: The Office of Industrial Economics, Ministry of Industry
กั
นยายน
September
ไตรมาสที่
3
Quarter 3
สิ
งหาคม
August
กรกฎาคม
July
รายการ
Item
2560
(2017)
Industrial Statistics
53
p


