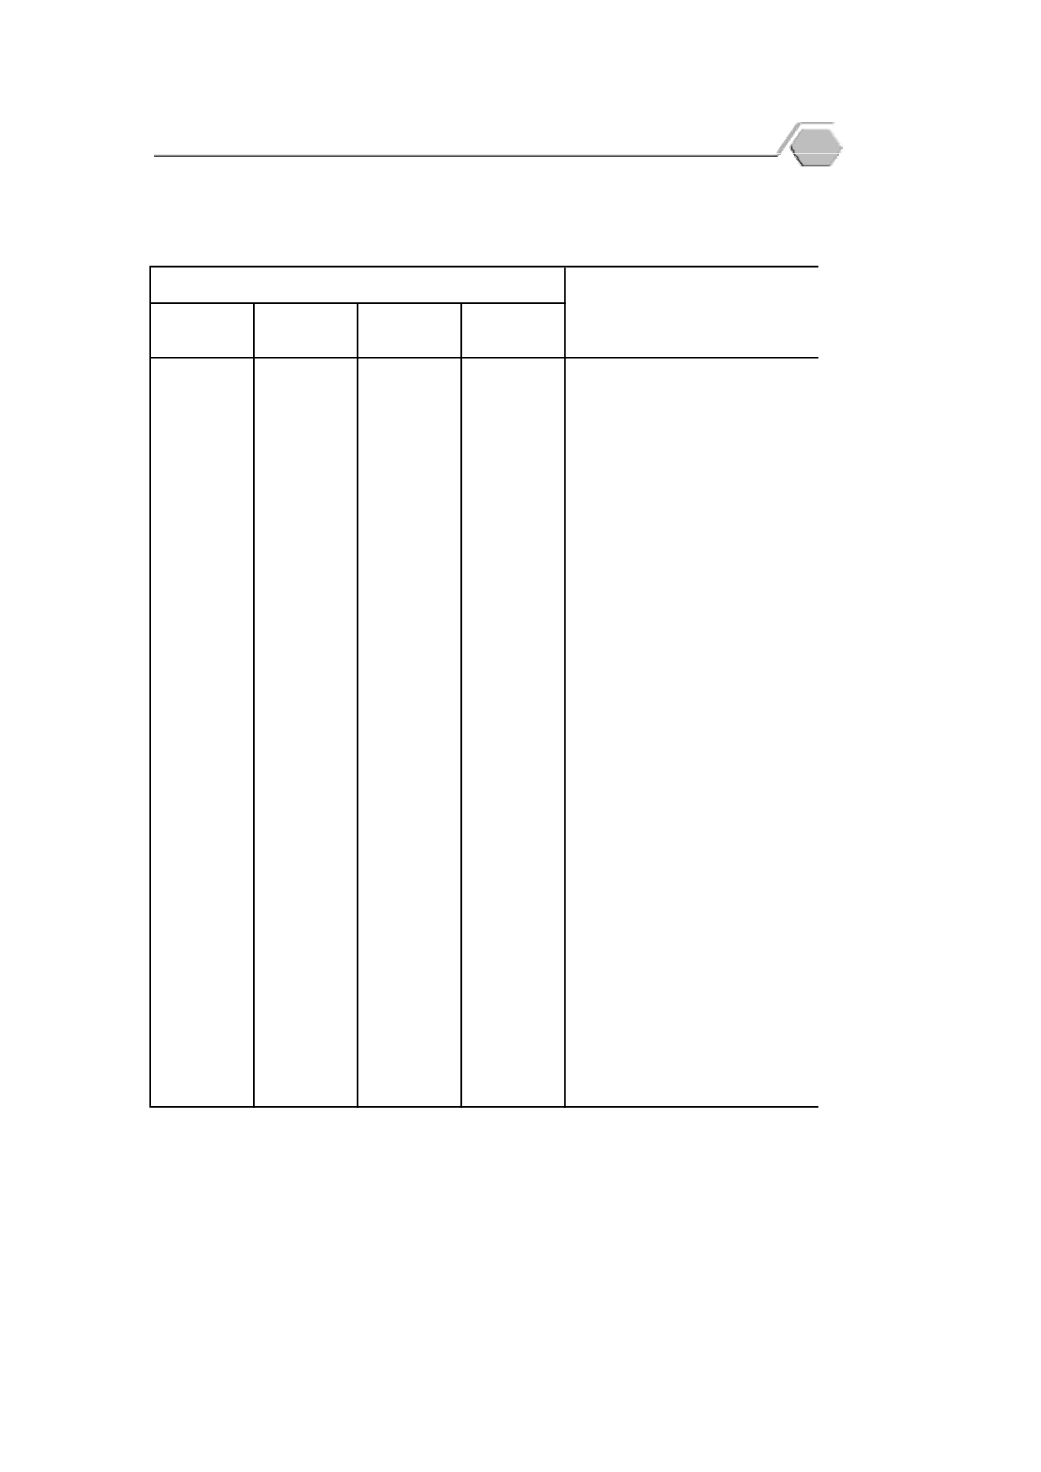
Table
8.2
Manufacturing Production Index
: 2017
Food
63.3
77.1
49.6
63.2
Canned fruit and vetgetable
94.7
97.8
88.3
97.9
Frozen seafood
Beverages
119.7
113.8
154.4
90.7
Beer
136.1
136.7
136.0
135.5
Soda and drinking water
77.8
65.0
111.4
56.9
Cigarette
Textiles and textile products
77.7
73.4
77.1
82.5
Weaving of textiles
83.8
81.4
90.8
79.1
Garment
169.8
167.1
176.3
165.9
Petroleum products
Construction materials
93.3
95.7
89.2
95.0
Cement
Iron and steel products
117.9
119.9
112.0
121.8
Finished metal plate
132.1
128.1
130.9
137.4
Other shape metal
Vehicles and equipments
144.4
132.1
145.4
155.6
Motor vehicles
119.5
118.6
120.0
120.0
Tyre
Radio, Television and Communication
114.8
113.2
116.1
115.0
Equipment and Apparatus
Others
98.3
104.2
95.3
95.4
Air conditioner and compressor
150.8
144.7
147.8
160.0
Pharmaceuticals, Chemicals Products
Source: The Office of Industrial Economics, Ministry of Industry
August
[2554 (2011) = 100]
2560 (2017)
Value added Weight)
กั
นยายน
September
สิ
งหาคม
Item
ไตรมาสที่
3
Quarter 3
กรกฎาคม
July
Industrial Statistics
55
p


