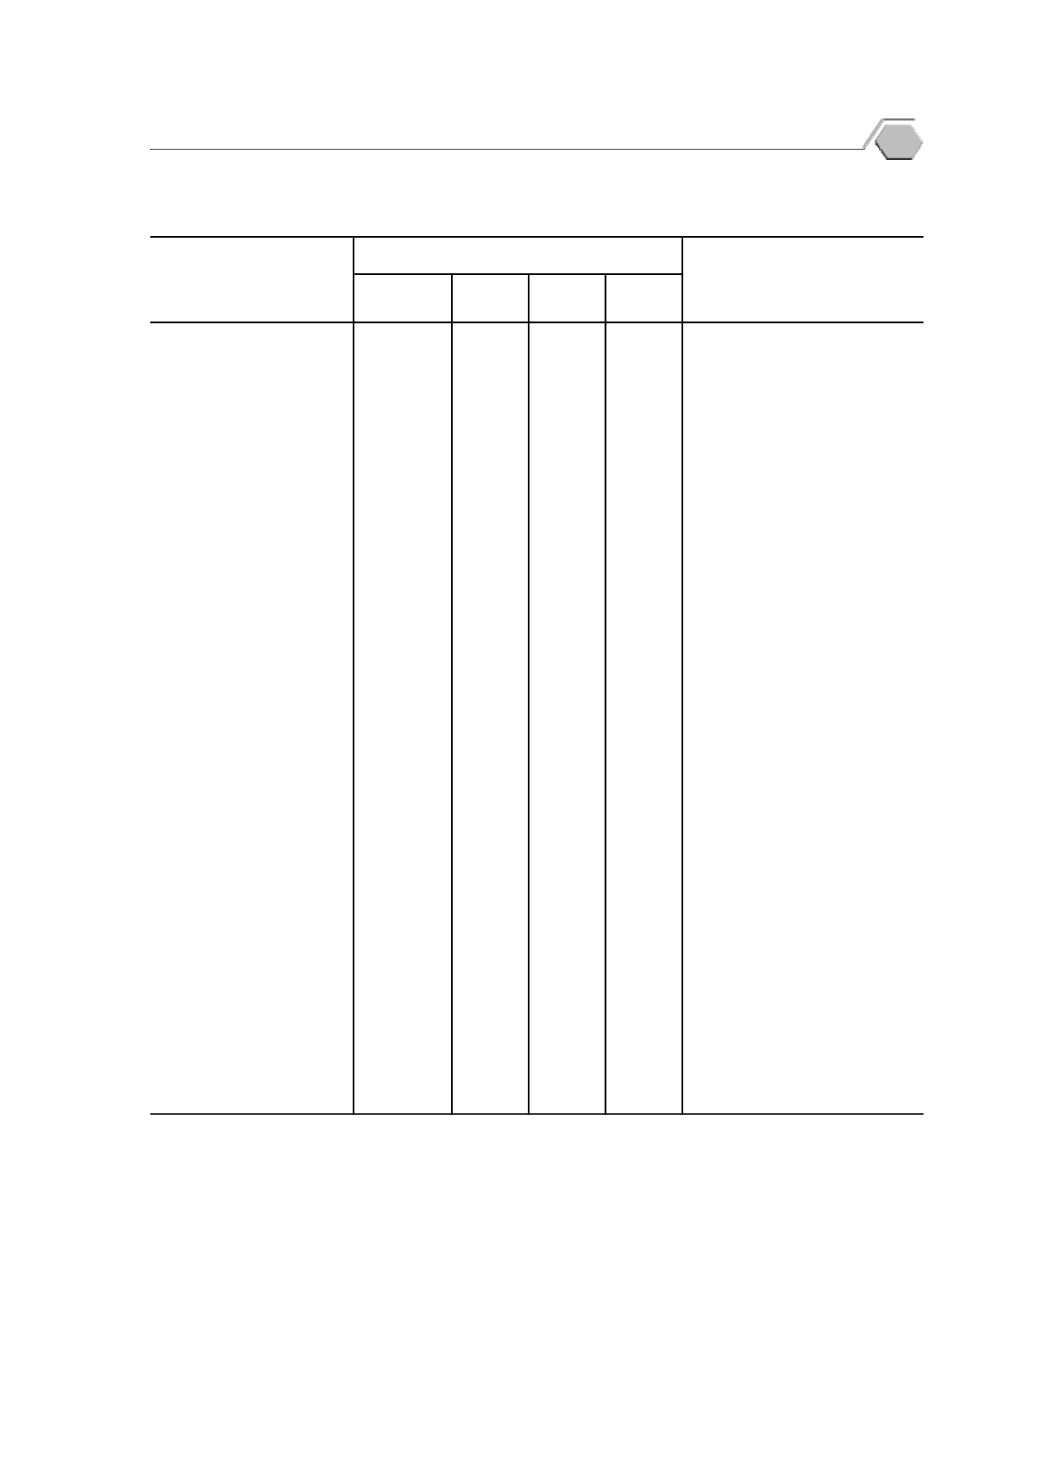
ตาราง
8.1
ผลผลิ
ตภาคอุ
ตสาหกรรม พ.ศ.
2561
Table
8.1
Production of Manufactured Goods
: 2018
กรกฎาคม
July
อาหาร (ตั
น)
Food (ton)
ผลไม
และผั
กกระป
อง................................
110,207
41,987 30,214 38,006
Canned fruit and vegetable
อาหารทะเลแช
แข็
ง.....................................
37,761
12,246 12,288 13,227
Frozen seafood
เครื่
องดื่
ม (พั
นลิ
ตร)
Beverages (thousand litres)
เบี
ยร
...........................................................
474,377
165,219 162,189 146,969
Beer
โซดาและน้ํ
าดื่
มต
างๆ.................................
957,588
307,561 342,018 308,009
Soda and drinking water
สิ่
งทอและผลิ
ตภั
ณฑ
สิ่
งทอ
Textiles and textile products
ผ
าทอ(ฝ
าย) (พั
นเมตร)............................
27,183
8,941 9,215 9,027
Cotton fabrics (thousand meters)
เสื้
อผ
าสํ
าเร็
จรู
ป (พั
นชิ้
น).........................
29,634
10,195 9,972 9,467
Garment (thousand pieces)
ผลิ
ตภั
ณฑ
ป
โตรเลี
ยม (ล
านลิ
ตร)
Petroleum products (million litres)
น้ํ
ามั
นเบนซิ
นออกเทน 91........................
536
190
199
147
Gas (unlead) oct
91
น้ํ
ามั
นเบนซิ
นออกเทน 95........................
801
265
264
272
Gas (unlead) oct
95
น้ํ
ามั
นดี
เซลหมุ
นเร็
ว...................................
7,769
2,621 2,541 2,607
Diesel oil high speed
วั
สดุ
ก
อสร
าง (พั
นตั
น)
Construction materials (thousand tons)
ซี
เมนต
ปอร
แลนด
......................................
7,408
2,559
2,419
2,431
Portland cement
ซี
เมนต
ผสม.................................................
2,243
725
758
760
Mixed cement
ปู
นเม็
ด.........................................................
11,422
3,837
3,820
3,765
Clinkers
เหล็
กและผลิ
ตภั
ณฑ
เหล็
ก (ตั
น)
Iron and steel products (ton)
เหล็
กแผ
นเคลื
อบสั
งกะสี
...........................
111,525
37,359 35,746 38,420
Galvanised sheets
ท
อเหล็
กกล
า...............................................
197,216
67,172 72,653 57,391
Pipe/Tube steel pipe
เหล็
กเส
นข
ออ
อย........................................
362,249
127,455 129,392 105,402
Bar deformd bars
ยานยนต
และอุ
ปกรณ
Vehicles and equipments
ยานยนต
(คั
น)...........................................
386,845
129,182 128,982 128,681
Motor vehicles (unit)
ยางรถยนต
(พั
นเส
น)...............................
25,357
8,684 8,605 8,069
Tyre (thousand units)
เครื่
องใช
ไฟฟ
า (พั
นเครื่
อง)
Electrical products (thousand units)
ตู
เย็
น ...........................................................
1,365
451
476
438
Refrigerator
เครื่
องซั
กผ
า................................................
1,271
428
463
380
Washing machine
เครื่
องปรั
บอากาศและคอมเพรสเซอร
...
6,251
2,117 2,162 1,972
Air conditioner and compressor
ผลิ
ตภั
ณฑ
เภสั
ชกรรม
Pharmaceuticals,
และเคมี
ภั
ณฑ
ต
างๆ (ตั
น).........................
10,806
3,643 3,457 3,706
Chemicals Products (ton)
ที่
มา: สํ
านั
กงานเศรษฐกิ
จอุ
ตสาหกรรม กระทรวงอุ
ตสาหกรรม
Source: The Office of Industrial Economics, Ministry of Industry
กั
นยายน
September
ไตรมาสที่
3
Quarter
3
สิ
งหาคม
August
รายการ
Item
2561
(2018)
Industrial Statistics
53
p


