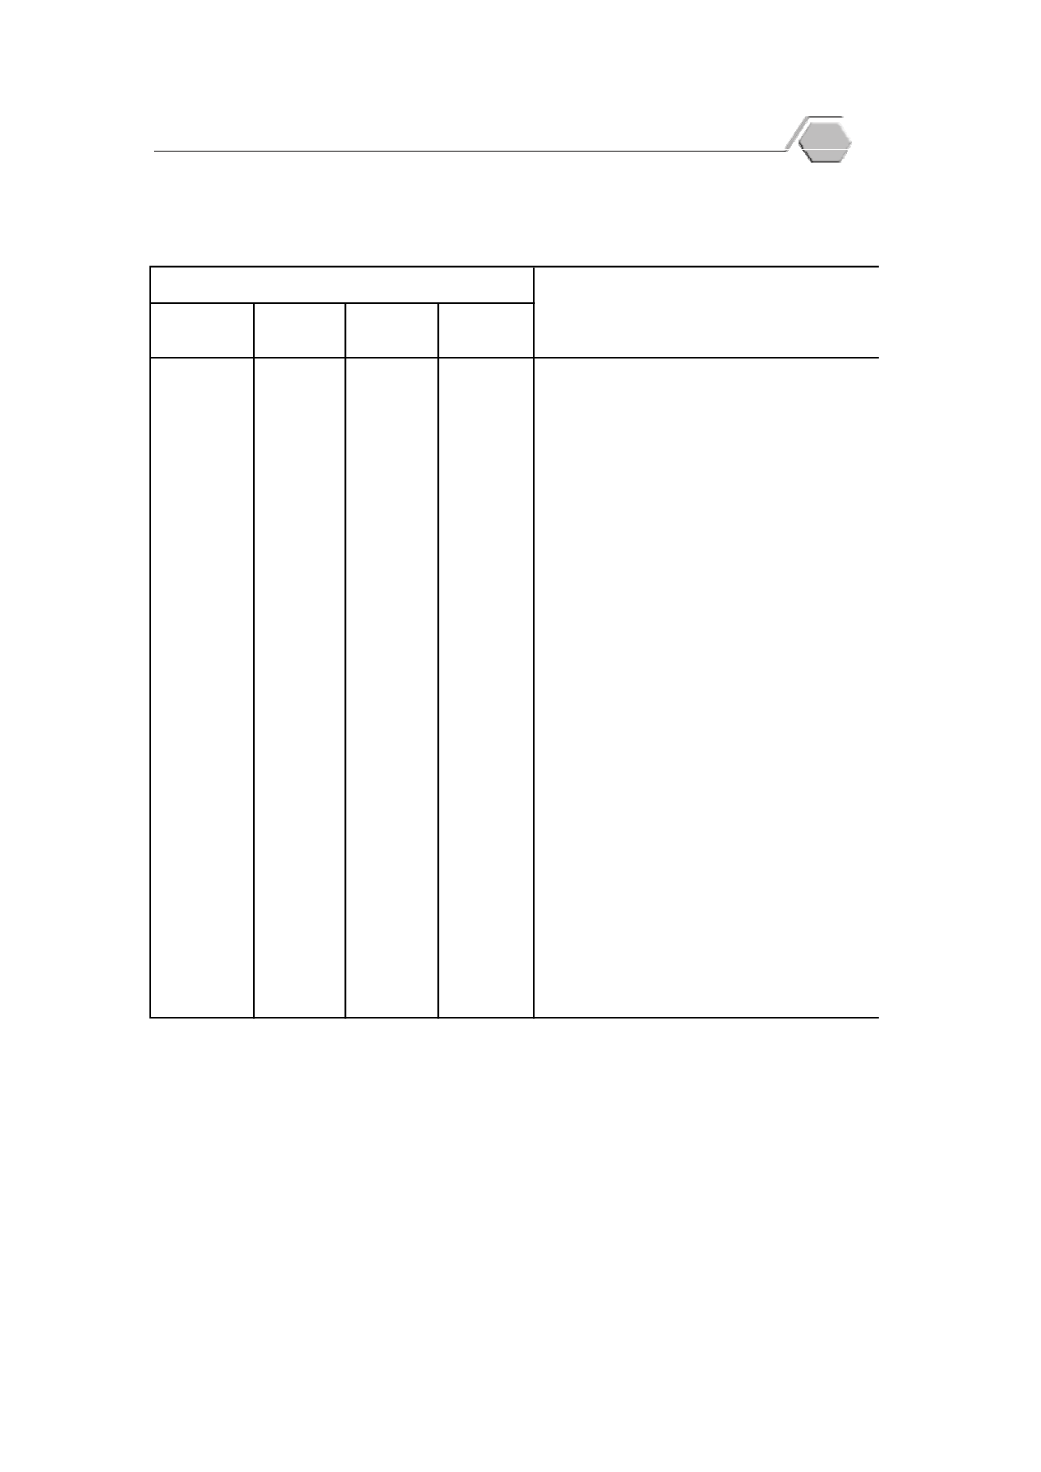
Table
8.2
Manufacturing Production Index
: 2018
กรกฏาคม
July
Food
77.4
71.2
73.2
87.7
Fresh or frozen fish product
49.2
45.4
47.3
54.8
Fresh or frozen aquatic animal product (except fish)
19.4
33.7
9.1
15.4
Canned fruit and vetgetable
Beverages
94.4
98.6
96.8
87.7
Beer
163.6
157.6
175.5
157.6
Drinking water
120.2
118.6
120.2
121.7
Soft drinks and sparkling water
52.7
48.7
57.5
51.8
Cigarette
64.1
63.8
65.9
62.4
Textile
92.9
91.8
93.2
93.6
Wearing apparel
186.8
190.9
189.4
180.0
Petroleum product
194.6
197.6
187.6
198.5
Pharmaceutical and Chemical Product
119.0
119.7
121.3
116.0
Tyre
Construction materials
101.5
102.74.
101.8
101.2
Cement
Iron and steel products
125.5
132.7
126.1
117.5
Iron and steel sheets
120.6
117.3
129.3
115.2
Other basic iron and steel
116.3
116.5
122.0
110.4
Air conditioner and compressor
141.7
146.7
136.2
142.3
Motor vehicle
Source: The Office of Industrial Economics, Ministry of Industry
Item
August
[2554 (2011) = 100]
2561 (2018)
Value added Weight)
กั
นยายน
September
สิ
งหาคม
ไตรมาสที่
3
Quarter
3
Industrial Statistics
55
p
r


