67
เครื่
องชี้
ภาวะเศรษฐกิ
จไทย พ.ศ. 2562
หน้
า
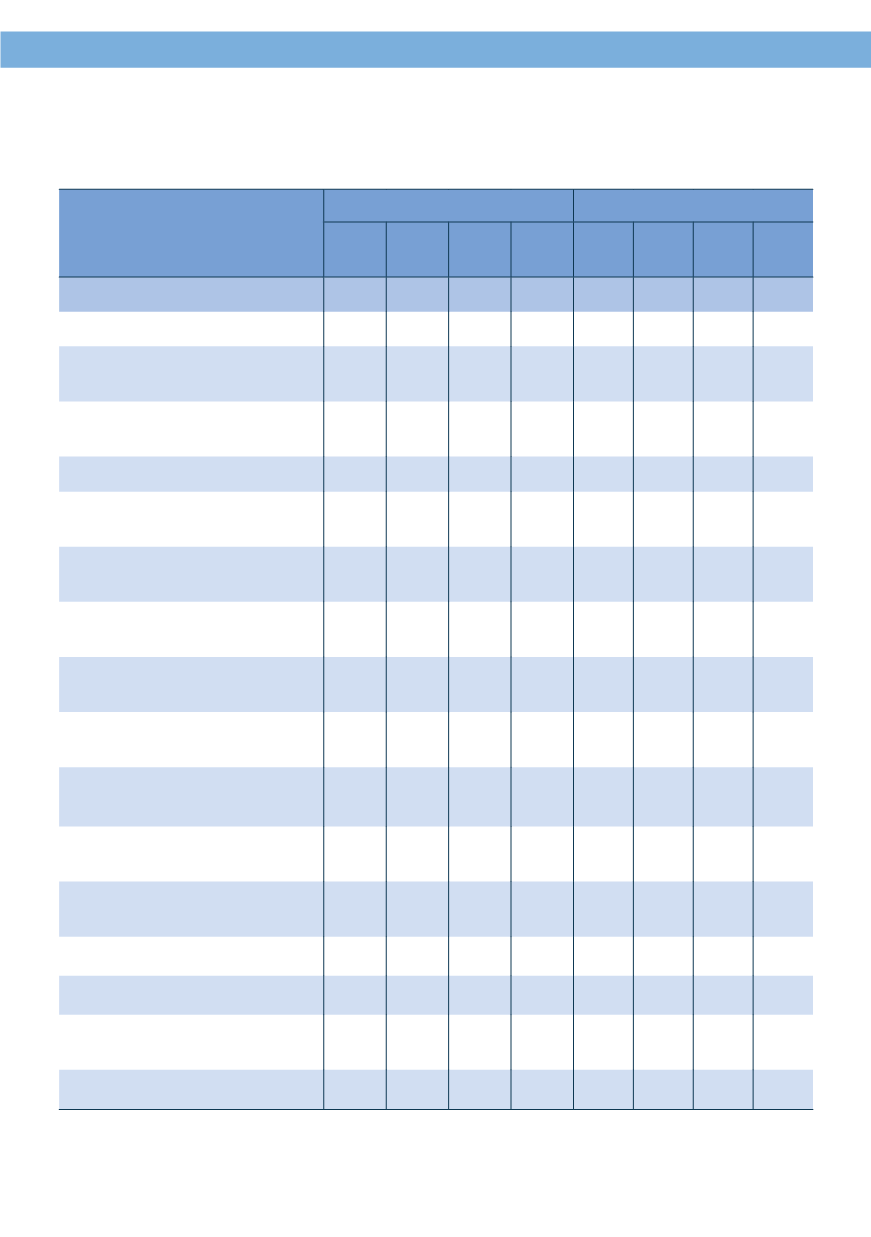
ตาราง 5.8 มู
ลค่
าสิ
นค้
านำ
าเข้
าที่
สำ
าคั
ญ พ.ศ. 2558 - 2561
Table 5.8 Value of Principal Imports: 2015 - 2018
รายการ Items
สั
ดส่
วน (Proportion) (%)
อั
ตราการขยายตั
ว (Growth Rate) (%)
2558
(2015)
2559
(2016)
2560
(2017)
2561
(2018)
2558
(2015)
2559
(2016)
2560
(2017)
2561
(2018)
รวม Total
100.00 100.00 100.00 100.00 -6.72 -0.26 10.15 6.29
น ้ ำ
ามั
นดิ
บ Crude Oil
9.60 7.56
8.47 10.84 -38.57 -21.46 23.35 36.07
เครื่
องจั
กรกลและส่
วนประกอบ
Machinery and Parts
9.65 9.81 8.80
8.33 -4.13 1.40
-1.15
0.54
เครื
่
องจั
กรไฟฟ้
าและส่
วนประกอบ
Electrical Machinery and Parts
7.84 8.45
7.81 7.72 8.85
7.53 1.84
5.01
เคมี
ภั
ณฑ์
Chemicals
6.46
6.68 6.67 6.72 -5.57
3.19
9.88 7.16
เครื
่
องเพชรพลอย อั
ญมณี
เงิ
นแท่
งและทองคำ
า
Jewellery including Silver Bars and Gold
4.61 4.11 6.45
6.02 10.69
-11.14
72.82
-0.84
เหล็
ก เหล็
กกล้
าและผลิ
ตภั
ณฑ์
Iron, Steel and Products
5.20
5.37
5.12
5.42 -13.77 3.07 5.03 12.47
ส่
วนประกอบและอุ
ปกรณ์
ยานยนต์
Parts and Accessories of Vehicles
4.96 5.46
5.15
4.83
16.27 9.72
3.85
-0.29
แผงวงจรไฟฟ้
า
Electronic Integrated Circuites
4.66 4.87 5.04 4.77
2.10
4.34 14.02
0.52
สิ
นแร่
โลหะอื
่
นๆ เศษโลหะและผลิ
ตภั
ณฑ์
Other
Metal Ores, Metal Waste Scrap, and Products
3.47 3.59 3.91 3.98 -6.39 3.34
19.75
8.42
เครื
่
องคอมพิ
วเตอร์
อุ
ปกรณ์
และส่
วนประกอบ
Computers, Parts and Accessories
3.68 3.42 3.39 3.61
-1.07
-7.42 9.24 13.15
เครื
่
องใช้
ไฟฟ้
าในบ้
าน
Electrical Household Appliances
3.36 3.47 3.24
2.89 0.57
2.73
2.95 -5.15
พื
ชและผลิ
ตภั
ณฑ์
จากพื
ช Vegetables
and Vegetable Products
3.12 3.14
2.77 2.62
6.03 0.14
-2.60
0.37
น ้ ำ
ามั
นสำ
าเร็
จรู
ป Finished Oils
-43.84 23.37
16.60 18.01
1.47
1.82
1.93 2.14
ก๊
าซธรรมชาติ
Natural Gas
-14.56 -37.54 14.51 25.84 2.64 1.66 1.72 2.04
ผลิ
ตภั
ณฑ์
ทำ
าจากพลาสติ
ก
Plastic Products
1.85 1.97 1.87
1.83
5.81
6.38 4.49 3.89
สิ
นค้
าอื
่
น ๆ Others
27.42 28.63
27.67 26.25 0.56
4.14 6.45
0.85
ที่
มา: สำ
านั
กงานปลั
ดกระทรวงพาณิ
ชย์
Source: Of ce of the Permanent Secretary, Ministry of Commerce


