74
Thai Economic Indicators 2019
หน้
า
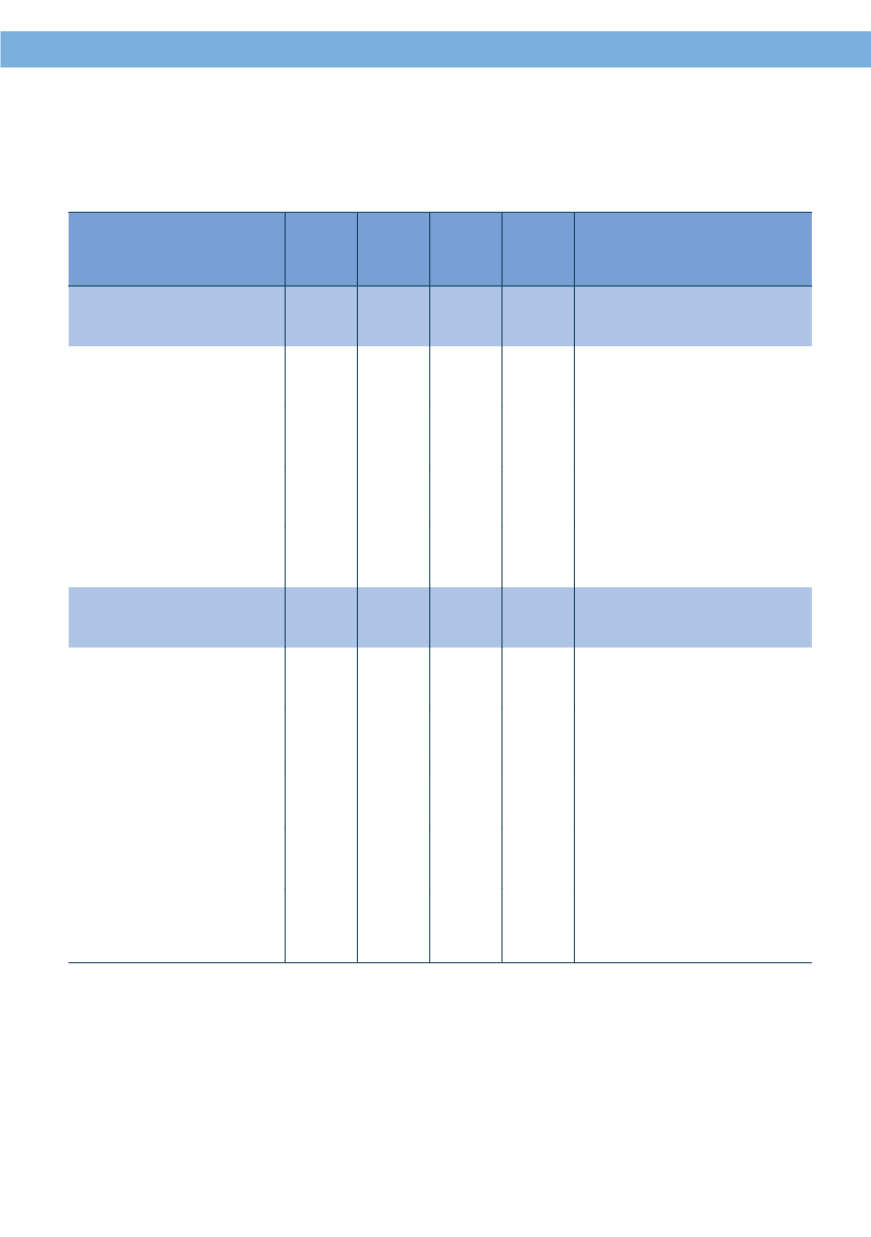
ตาราง 5.16 ดั
ชนี
ราคาส่
งออก และราคานำ
าเข้
า จำ
าแนกตามหมวดสิ
นค้
า พ.ศ. 2558 - 2561
Table 5.16 Export Price and Import Price Index by Commodity Group: 2015 - 2018
รายการ
2558
2015
2559
2016
2560
2017
2561
2018
Items
ดั
ชนี
ราคาส่
งออก
94.3 93.9 97.3 100.6
Export Price Index
สิ
นค้
าเกษตรกรรม
85.0 83.9 91.7 97.6 Agricultural Products
สิ
นค้
าอุ
ตสาหกรรม
การเกษตร
98.1 98.9 106.8 107.0 Agro-Industrial Products
สิ
นค้
าอุ
ตสาหกรรมสำ
าคั
ญ 98.5 98.5 100.1 101.6 Principal Manufacturing
Products
สิ
นค้
าแร่
และเชื้
อเพลิ
ง
58.5 54.8 65.9 82.1 Mineral Products and Fuel
ดั
ชนี
ราคานำ
าเข้
า
85.7 83.4 88.0 93.0 Imports Price Index
สิ
นค้
าเชื้
อเพลิ
ง
57.0 46.9 58.7 73.5 Fuel Lubricants
สิ
นค้
าทุ
น
97.6 99.0 100.5 102.3 Capital Goods
สิ
นค้
าวั
ตถุ
ดิ
บและ
กึ่
งสำ
าเร็
จรู
ป
90.4 90.3 93.4 96.7 Raw Materials and
Intermediate Products
สิ
นค้
าอุ
ปโภคบริ
โภค
99.1 99.2 100.8 102.3 Consumer goods
สิ
นค้
ายานพาหนะและ
อุ
ปกรณ์
การขนส่
ง
88.6 92.3 92.9 96.1 Vehicles and Transport
Accessories
ที่
มา: สำ
านั
กดั
ชนี
เศรษฐกิ
จการค้
า กระทรวงพาณิ
ชย์
Source: Bureau of Trade and Economic Indices, Ministry of Commerce
ปี
ฐาน 2555 : Fixed Base Year 2012


