แร่
และพลั
งงาน
สถิติสิ่
งแวดล้
อมของประเทศไทย พ.ศ.
2563
119
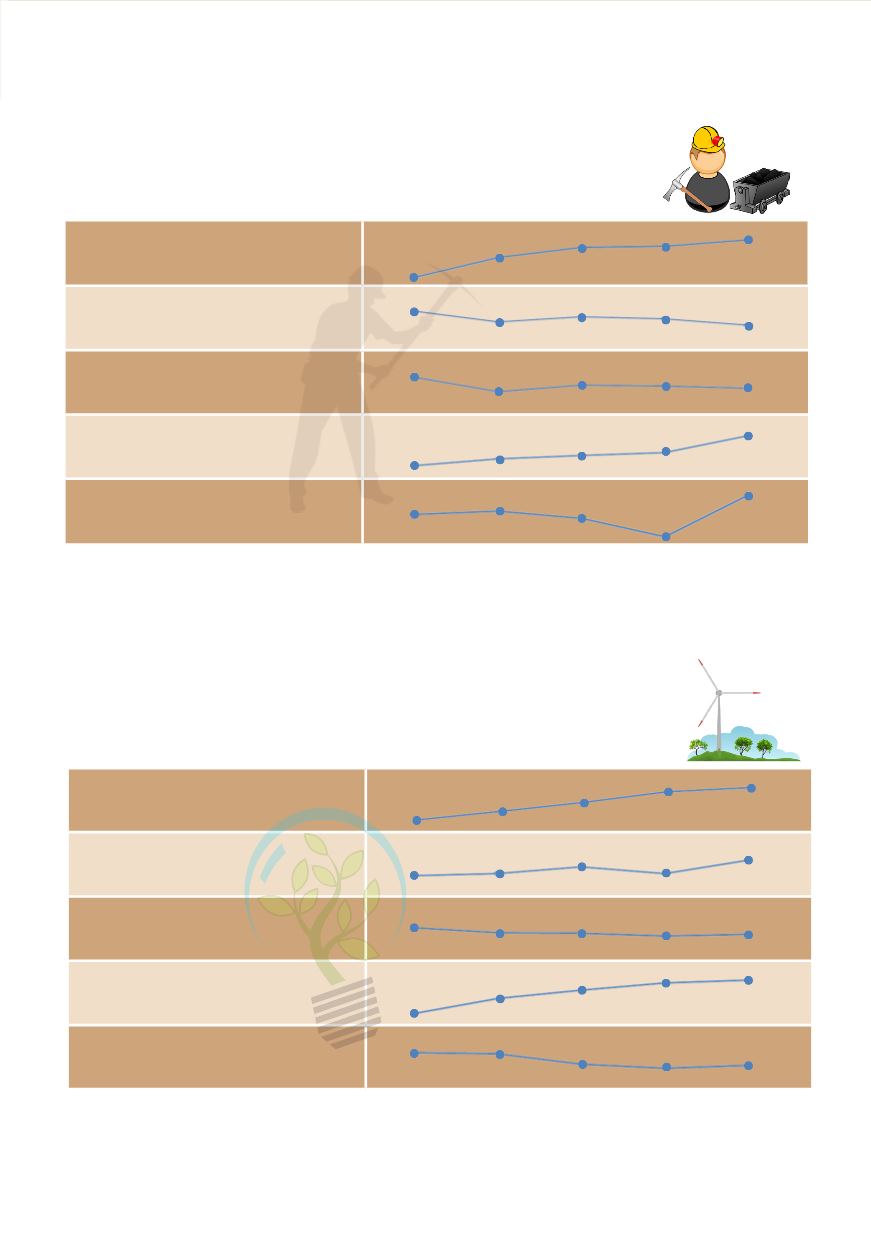
แผนภู
มิ 6.1 การใช้
แร่
พ.ศ. 2557 - 2561
Figure 6.1 Consumption of Principal Minerals: 2014 - 2018
หน่วย (Unit): พั
นตั
น (Thousand Tons)
2557 2558 2559 2560 2561
2014 2015 2016 2017 2018
ที่
มา: กรมพั
ฒนาพลั
งงานทดแทนและอนุ
รั
กษ์พลั
งงาน กระทรวงพลั
งงาน
Source: Department of Alternative Energy Development and Ef ciency, Ministry of Energy
แผนภู
มิ 6.2 การใช้
พลั
งงานขั้
นสุ
ดท้
าย พ.ศ. 2557 - 2561
Figure 6.2 Final Energy Consumption: 2014 - 2018
ที่
มา: กรมอุ
ตสาหกรรมพื้นฐานและการเหมืองแร่
กระทรวงอุ
ตสาหกรรม
Source: Department of Primary Industries and Mines, Ministry of Industry
หน่วย (Unit): พั
นตั
นเที
ยบเท่าน�
้ามั
นดิ
บ (Ktoe)
2557 2558 2559 2560 2561
2014 2015 2016 2017 2018
หินปู
น (หินอุ
ตสาหกรรมก่
อสร้าง)
Limestone (Industrial Rock-Construction)
ลิกไนต์
Lignite
หินบะชอลต์
(หินอุ
ตสาหกรรม)
Basalt (Industrial Rock)
แกรนิต (หินอุ
ตสาหกรรม)
Granite (Industrial Rock)
ดินอุ
ตสาหกรรม
Cement Clay
การขนส่
ง
Transportation
อุ
ตสาหกรรมการผลิต
Manufacturing
ที่
อยู่
อาศั
ย
Residential
การค้า
Commercial
เกษตรกรรม
Agriculture
89,267.6
95,625.7
98,991.2
98,770.6
101,130.5
18,457.2
15,369.2
14,417.9
16,240.6
16,869.3
13,980.3
12,055.7
12,487.0
12,822.1
12,927.8
6,807.2
7,893.1
11,570.4
8,926.2
8,392.6
4,548.2
4,760.4
5,786.3
3,142.8
4,278.9
26,801
28,501
30,190
33,086
32,322
27,875
30,191
28,210
29,206
28,183
11,459
11,001
10,867
11,071
11,099
5,470
6,549
6,452
6,215
5,952
3,957
2,876
2,652
2,987
3,891


