Land / Soil
Thailand Environment Statistics 2020
74
ตารางที่
3.4 ผลผลิตของพืชที่
สำ
าคั
ญ ปีเพาะปลู
ก พ.ศ. 2558 - 2562
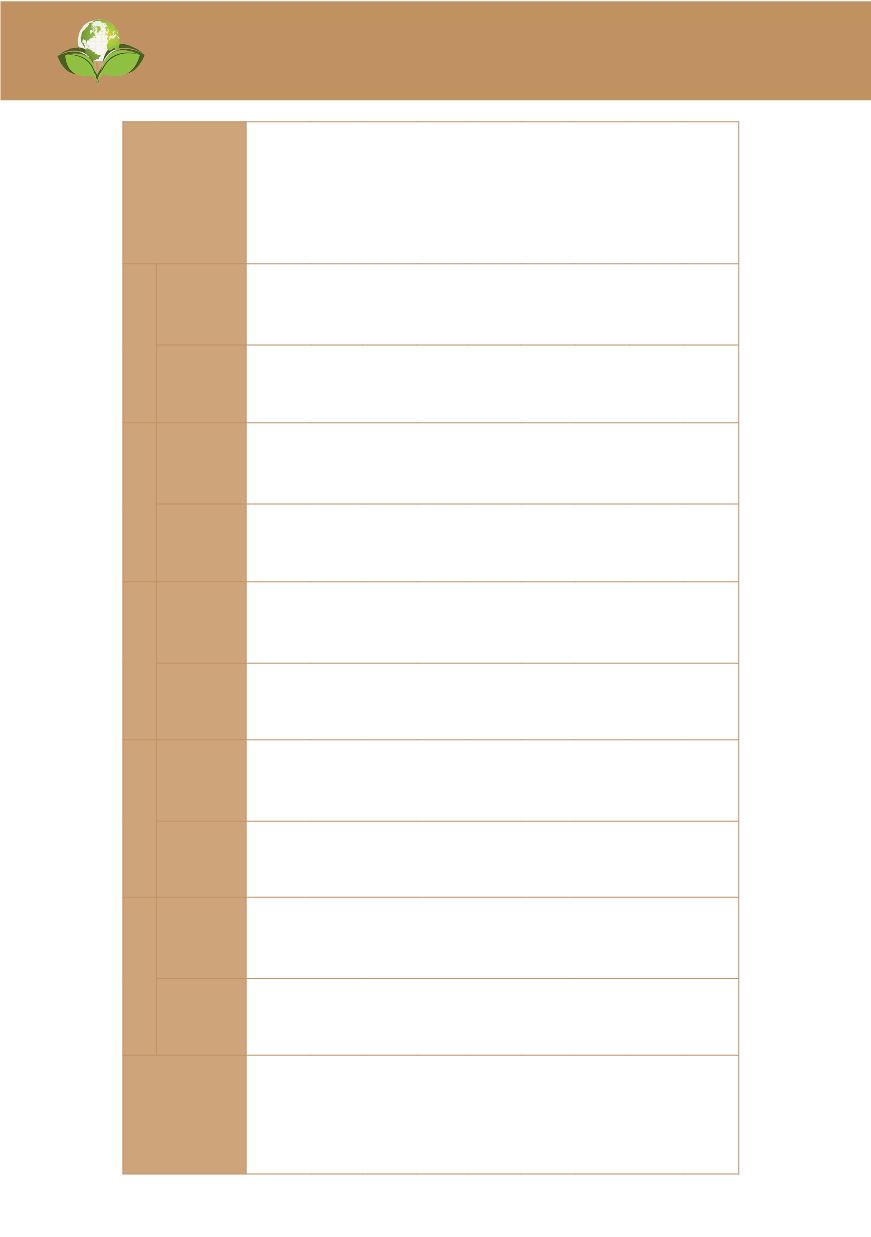
Table 3.4 Production of Major Crops: Crop Year: 2015 - 2019
พืชที่
สำ
าคั
ญ
2558 (2015)
2559 (2016)
2560 (2017)
2561 (2018)
2562 (2019)
Major Crops
ผลผลิ
ต
Production
(1,000 ตั
น)
(1,000Tons)
ผลผลิ
ต
เฉลี
่
ยต่
อไร่
(กก.) Yield
per Rai (kg.)
ผลผลิ
ต
Production
(1,000 ตั
น)
(1,000Tons)
ผลผลิ
ต
เฉลี
่
ยต่
อไร่
(กก.) Yield
per Rai (kg.)
ผลผลิ
ต
Production
(1,000 ตั
น)
(1,000Tons)
ผลผลิ
ต
เฉลี
่
ยต่
อไร่
(กก.) Yield
per Rai (kg.)
ผลผลิ
ต
Production
(1,000 ตั
น)
(1,000Tons)
ผลผลิ
ต
เฉลี
่
ยต่
อไร่
(กก.) Yield
per Rai (kg.)
ผลผลิ
ต
Production
(1,000 ตั
น)
(1,000Tons)
ผลผลิ
ต
เฉลี
่
ยต่
อไร่
(กก.) Yield
per Rai (kg.)
ข้าว
(นาปี
และนาปรั
ง)
27,420
456
31,857
476
32,899
491
32,348
486
28,357
f
467
f
Rice
(Major and Second Rice)
ยางพารา
4,414
240
4,350
235
4,503
236
4,813
p
240
p
4,840
f
237
f
Para Rubber
มั
นสำ
าปะหลั
ง
โรงงาน
32,358 3,611 31,161
3,437 30,495
3,499 29,368
3,527
31,080
3,586
Cassava
(for Industry)
ข้
าวโพดเลี
้
ยงสั
ตว์
4,029
642
4,390
681
4,821
736
5,069
735
4,222
f
722
f
Maize
ปาล์
มน้ำ
ามั
น
12,163 2,905 11,420 2,605 14,452
2,901 15,535
2,902 16,772
f
2,994
f
Oil Palm
สั
บปะรดโรงงาน 1,825 4,085 2,014 4,082 2,328
4,173 2,351
4,136 1,680
p
3,601
p
Pineapple
(for Industry)
กาแฟ
26
104
31
120
26
102
24
92
25
107
Coffee
ถั่
วเหลือง
42
260
38
277
43
283
41
274
40
f
275
f
Soybean
อ้อยโรงงาน 106,333 11,086 94,064 9,152 92,989
9,426 131,717 11,772 128,530 10,749 Sugarcane
(for Industry)
หมายเหตุ
: p = ตั
วเลขเบื้องต้น
f = ตั
วเลขจากการคาดคะเน
Note: p = preliminary data f = forecast data
ที่
มา: สำ
านั
กงานเศรษฐกิจการเกษตร กระทรวงเกษตรและสหกรณ์ Source: Of ce of Agricultural Economics, Ministry of Agriculture and Cooperatives


