21
แรงงาน
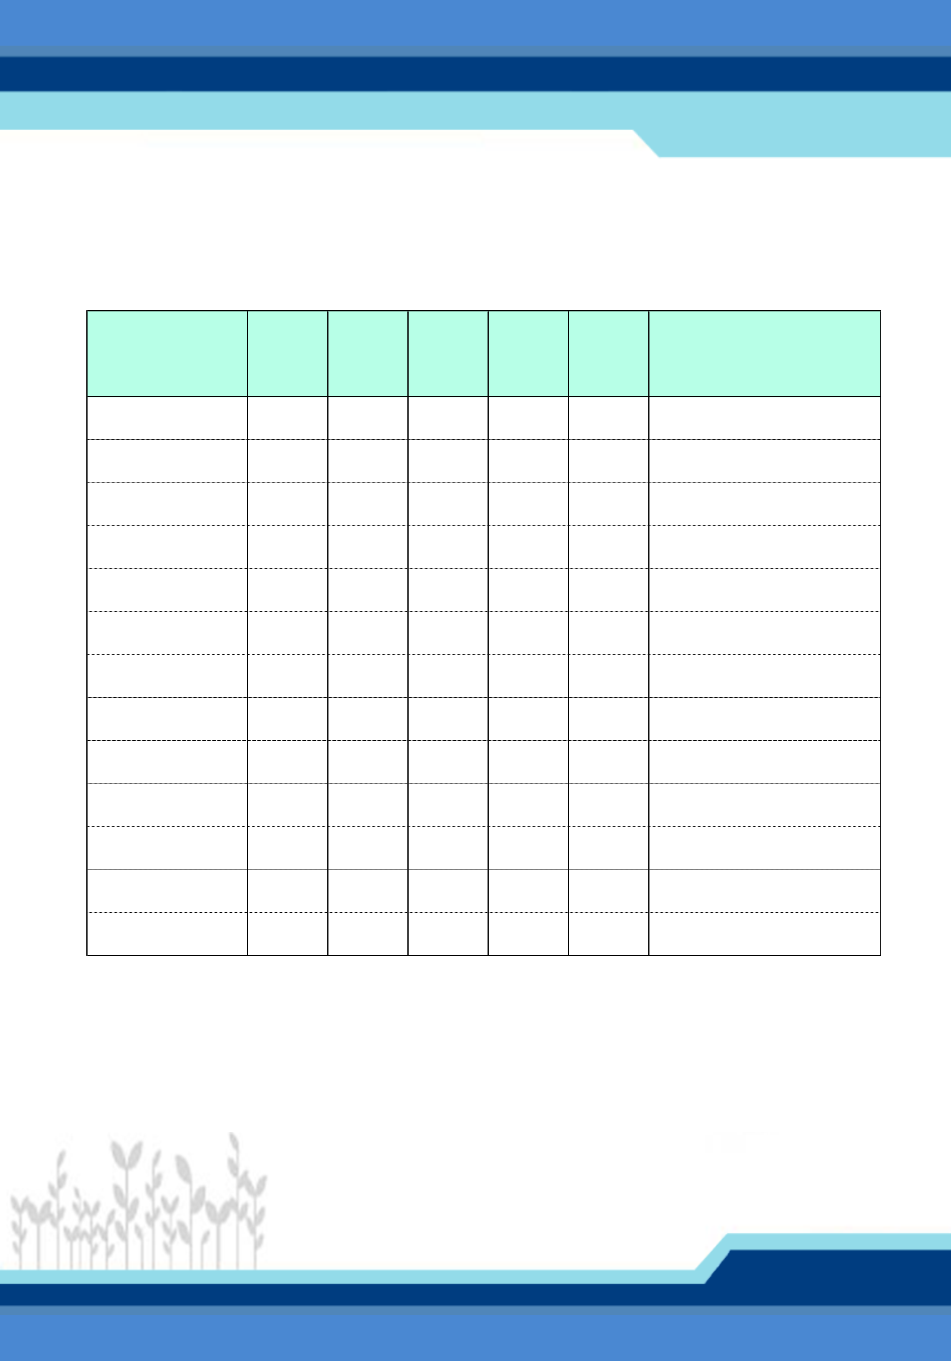
Labor Force
2553 2554 2555 2556 2557
(2010)
(2011)
(2012)
(2013)
(2014)
จำนวน
Number
ประชำกรอำยุ
15 ปี
ขึ้
นไป 53,550.0
54,071.8
54,581.1
55,090.7
54,898.6
Population 15 years and over
กำลั
งแรงงำนรวม
39,092.8
39,623.4
39,843.4
39,467.4
38,811.1 Total labor force
ผู้
มี
งำนทำ
38,691.6
39,317.2
39,578.3
39,112.4
38,421.0 Employed
ผู้
ว่
ำงงำน
341.0
262.4
230.8
305.6
326.6 Unemployed
ผู้
ที่
รอฤดู
กำล
60.3
43.7
34.2
49.4
63.5 Seasonally inactive labor force
ผู้
ไม่
อยู่
ในกำลั
งแรงงำน
14,457.2
14,448.4
14,737.8
15,623.3
16,087.5 Persons not in labor force
ร้
อยละ
Percent
กำลั
งแรงงำนรวม
73.0
73.3
73.0
71.6
70.7
Total labor force
ผู้
มี
งำนทำ
72.3
72.7
72.5
71.0
70.0
Employed
ผู้
ว่
ำงงำน
0.6
0.5
0.4
0.6
0.6
Unemployed
ผู้
ที่
รอฤดู
กำล
0.1
0.1
0.1
0.1
0.1
Seasonally inactive labor force
ผู้
ไม่
อยู่
ในกำลั
งแรงงำน
27.0
26.7
27.0
28.4
29.3
Persons not in labor force
สถำนภำพแรงงำน
Labor Force Status
สถานภาพแรงงานของประชากรอายุ
15 ปี
ขึ้
นไป พ.ศ. 2553 - 2557
Population Aged 15 years and over by Labor Force Status : 2010 - 2014
ที่
มำ: กำรสำรวจภำวะกำรทำงำนของประชำกร ไตรมำส 3: กรกฎำคม-กั
นยำยน
พ.ศ. 2553 - 2557 สำนั
กงำนสถิ
ติ
แห่
งชำติ
Source: The Labor Force Survey Round 3: July-September 2010 - 2014,
National Statistical Office.
1,000 คน / Persons


