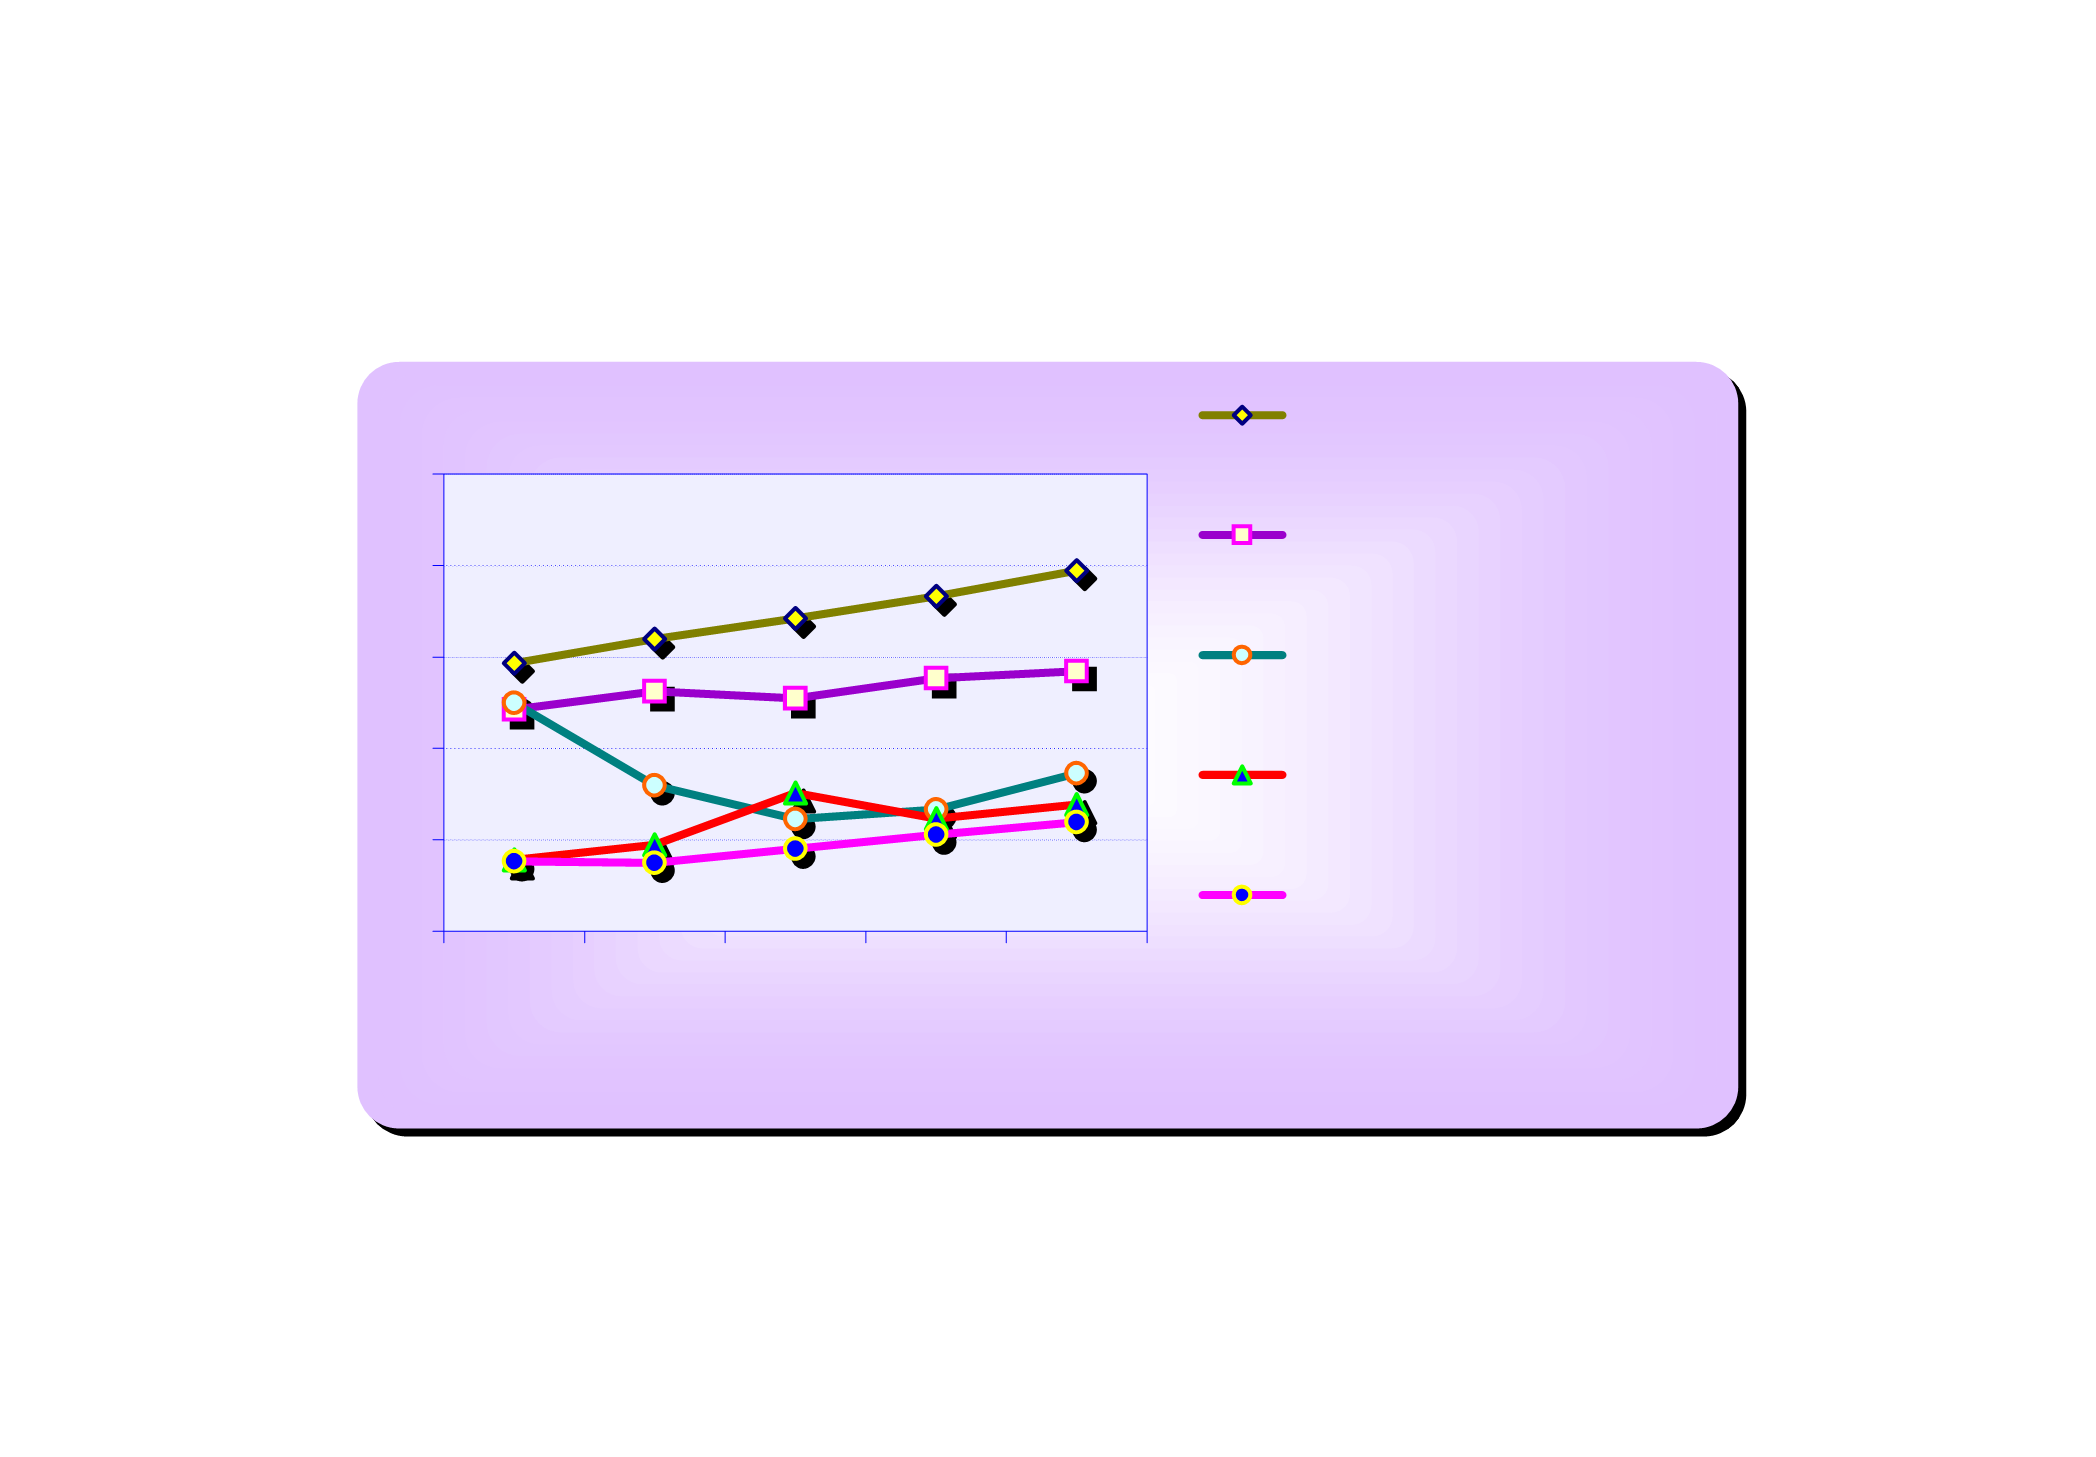
FIGURE 4.1 DEATH RATE PER 100,000 POPULATION BY LEADING CAUSE GROUPS: 1999 - 2003
ที่
มา: สํ
านั
กงานปลั
ดกระทรวงสาธารณสุ
ข
Source: Office of the Permanent Secretary for Public Health
แผนภู
มิ
4.1
อั
ตราการตายต
อประชากร
100,000
คน จํ
าแนกตามกลุ
มสาเหตุ
ที่
สํ
าคั
ญ พ.ศ.
2542 - 2546
0
20
40
60
80
100
2542
(1999)
2543
(2000)
2544
(2001)
2545
(2002)
2546
(2003)
มะเร็
งทุ
กชนิ
ด Malignant neoplasm, all forms
อุ
บั
ติ
เหตุ
และการเป
นพิ
ษ Accident and poisonings
ความดั
นเลื
อดสู
ง และหลอดเลื
อดในสมอง
Hypertension and cerebrovascular disease
โรคหั
วใจ Disease of the heart
โรคปอดอั
กเสบ และโรคอื่
นๆ ของปอด Pneumonia
and other diseases of lung
คน
Person


