แผนภู
มิ
9.2
ผลิ
ตภั
ณฑ
ภาคต
อคน ตามราคาป
2531
พ.ศ.
2547
ที่
มา: สํ
านั
กงานคณะกรรมการพั
ฒนาการเศรษฐกิ
จและสั
งคมแห
งชาติ
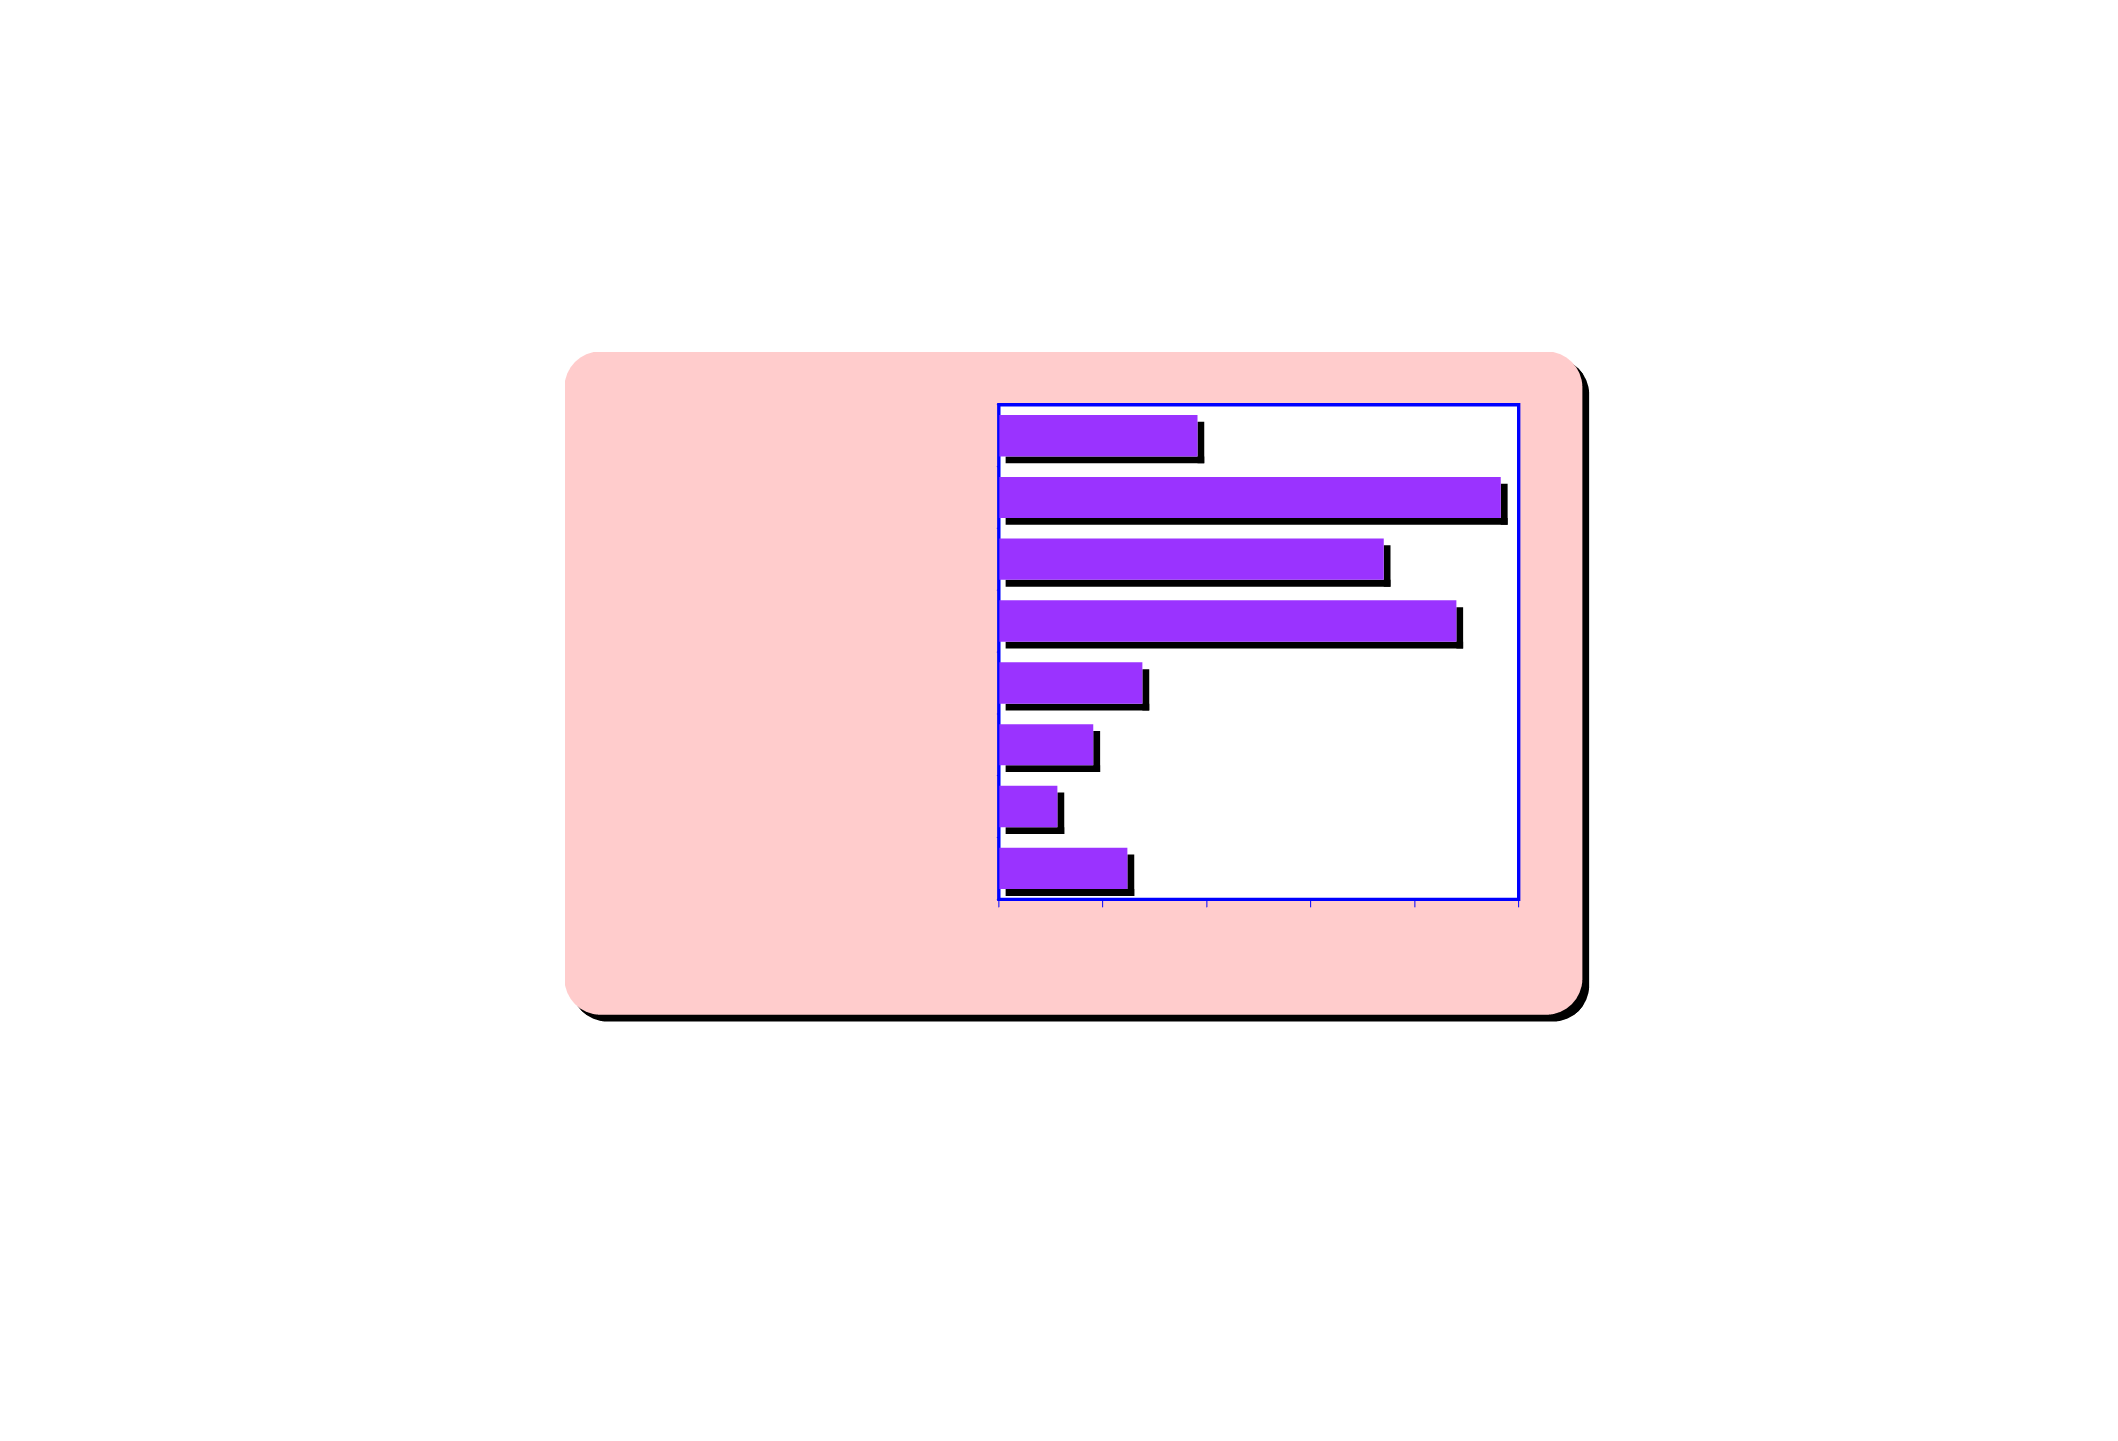
FIGURE 9.2 PER CAPITA GROSS REGIONAL PRODUCT AT 1988 PRICE: 2004
Source: Office of the National Economic and Social Development Board
36,924
16,804
27,148
41,234
131,912
110,942
144,682
57,193
0 30,000 60,000 90,000 120,000 150,000
ทั
่
วราชอาณาจั
กร Whole
Kingdom
ภาคกลางส
วนกลาง
Sub-Central
Region
ภาคตะวั
นออก
Eastern Region
ภาคตะวั
นตก
Western Region
ภาคเหนื
อ Northern Region
กรุ
งเทพมหานครและปริ
มณฑล
Bangkok and Vicinities
ภาคตะวั
นออกเฉี
ยงเหนื
อ
Northeastern Region
ภาคใต
Southern Region
บาท
Baht
16,804


