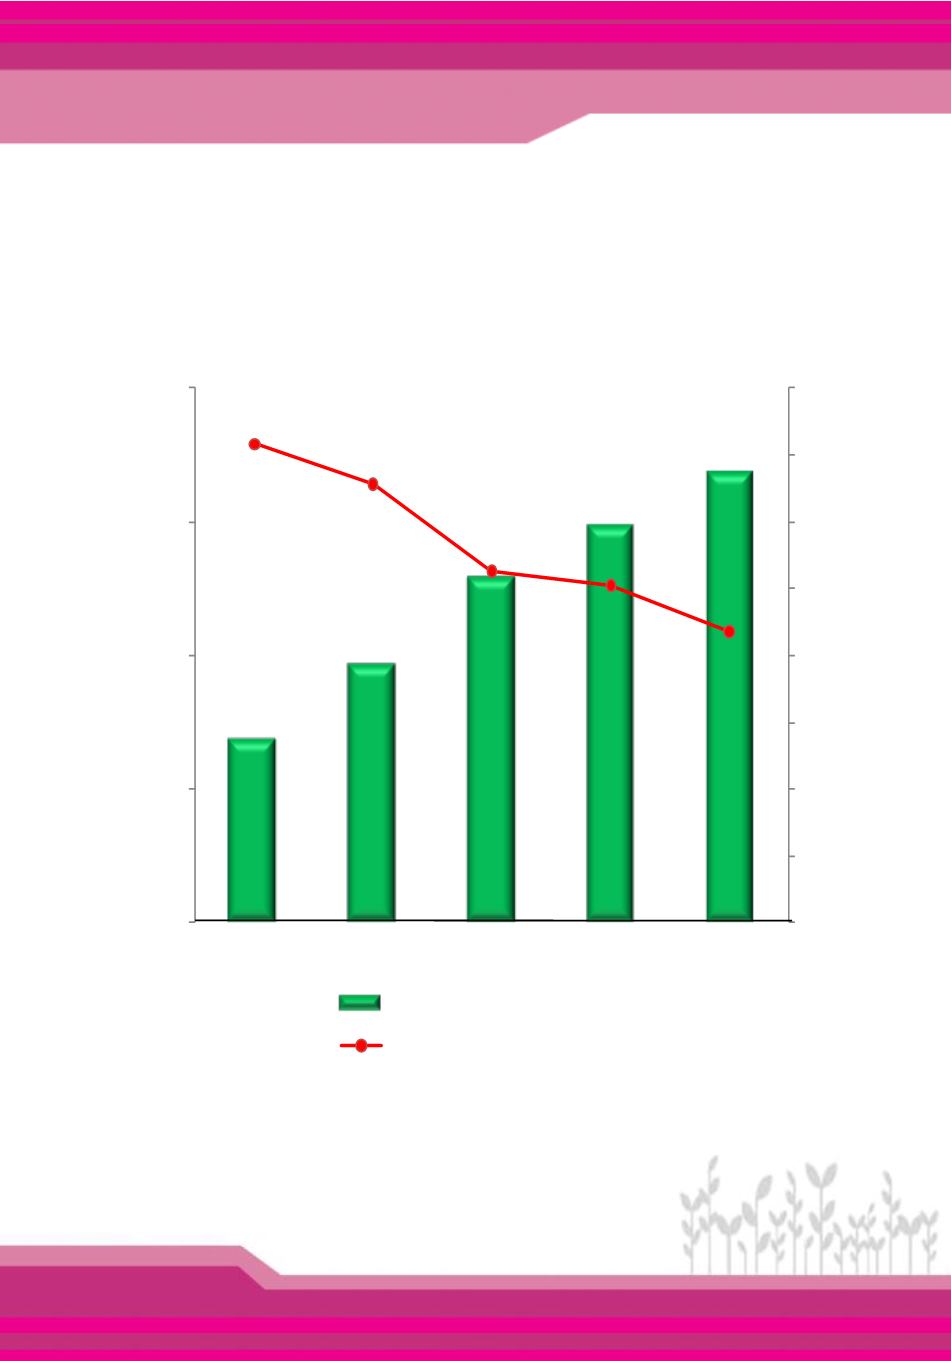
เส้
นความยากจน และสั
ดส่
วนคนจน พ.ศ. 2552 - 2556
Poverty Line and Headcount Ratio: 2009 – 2013
2,174
2,285
2,415
2,492
2,572
17.9
16.4
13.2
12.6
10.9
1,900
2,000
2,100
2,200
2,300
2,400
2,500
2,600
2,700
0.0
5.0
10.0
15.0
20.0
สน ม ก น Poverty Line
สดส น น น Head Count Ratio
%
บา / คน / เดื
อน : Baht / Person / Month
2552 2553 2554 2555 2556 ป
2009 2010 2011 2012 2013 Year
ทม : ส นกง น ณะก มก พฒน ก ศ ษฐก แ ะสง มแ
ง ต ส นกน ก
ฐมนต
Source: Office of the National Economic and Social Development Board,
Office of the Prime Minister
รายได้
ค่
าใช้
จ่
าย และหนี้
สิ
นของครั
วเรื
อน
Household Income, Expenditure and Debt
36


