สั
ดส
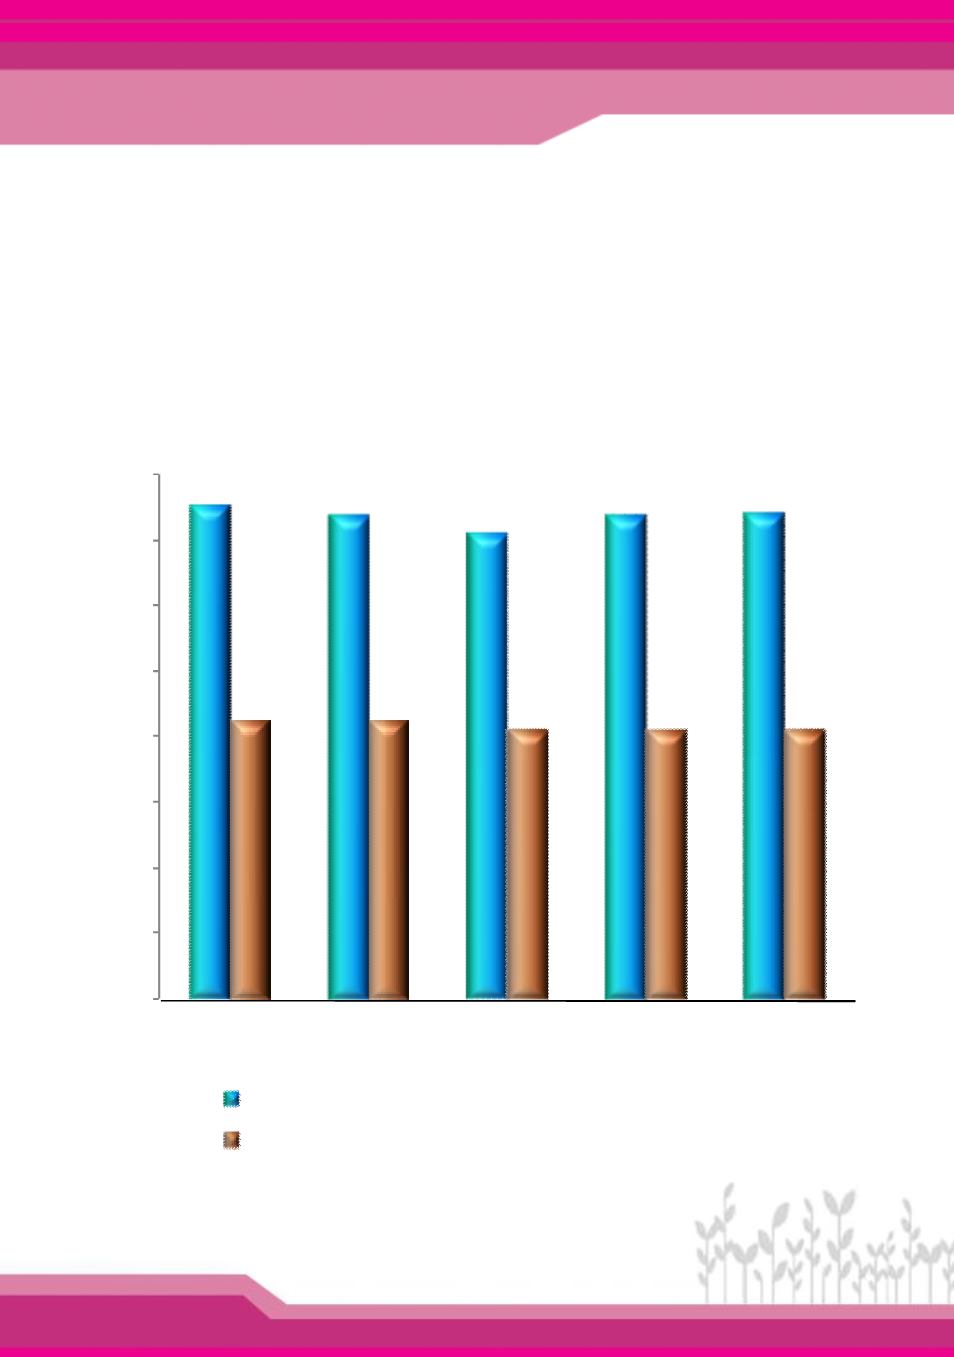
วนปริ
มาณการจั
ดหาและการใช
พลั
งงาน ต
อ GDP ล
านบาท
พ.ศ. 2553 - 2557
Proportion of Primary Energy Supply and Final Energy Consumption
per GDP Millions of Baht: 2010 – 2014
15.0
14.7
14.2
14.7
14.8
8.5
8.5
8.2
8.2
8.2
0.0
2.0
4.0
6.0
8.0
10.0
12.0
14.0
16.0
การจั
ดหาพลั
งงาน Primary Energy Supply
การใช
พลั
งงาน Final Energy Consumption
ตั
นเที
ยบเท
าน้ํ
ามั
นดิ
บต
อล
านบาท / Ton of Oil Equivalent per Million Baht
2553 2554 2555 2556 2557
P
ป
2010 2011 2012 2013 2014
P
Year
ที่
มา: กรมพั
ฒนาพลั
งงานทดแทนและอนุ
รั
กษ
พลั
งงาน กระทรวงพลั
งงาน
Source: Department of Alternative Energy Development and Efficiency, Ministry of Energy.
พลั
งงาน
Energy
40


