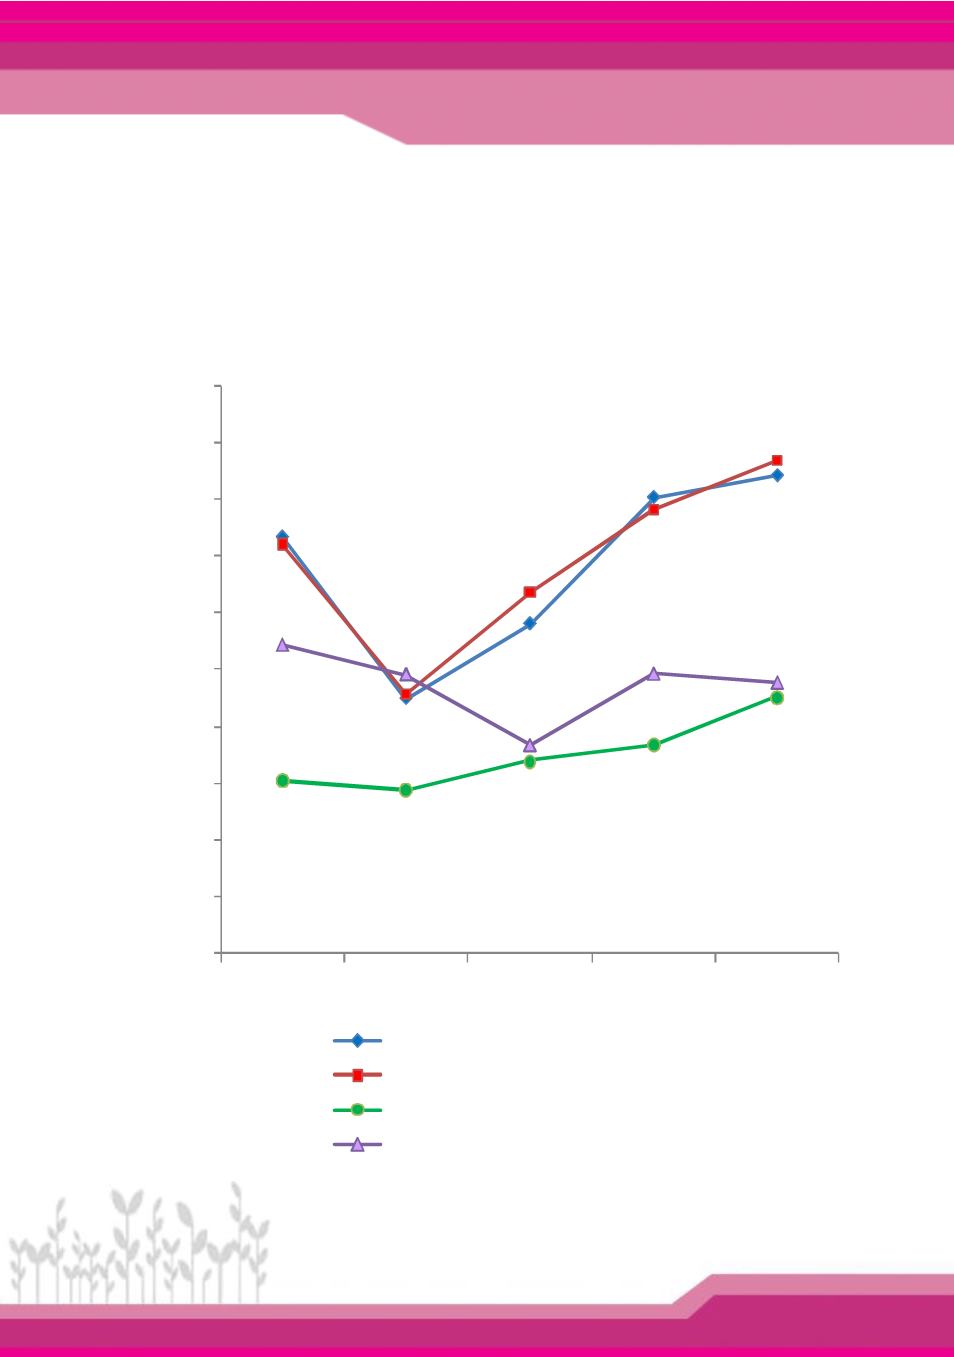
ราคาเฉลี่
ยของพลั
งงานที่
นํ
าเข
า พ.ศ.
2551 - 2555
Average Prices of Selected Imported Energy: 2008 – 2012
733.5
448.4
580.5
803.7
842.0
720.9
457.1
636.3
782.9
868.7
305.3
288.0
339.0
367.8
452.2
544.7
492.7
367.6
493.7
478.2
0.0
100.0
200.0
300.0
400.0
500.0
600.0
700.0
800.0
900.0
1000.0
2551/2008 2552/2009 2553/2010 2554/2011 2555/2012
น้ํ
ามั
นดิ
บ Crude Oil
น้ํ
ามั
นสํ
าเร็
จรู
ป Petroleum Products
ก
าซธรรมชาติ
Natural Gas
ไฟฟ
า Electricity
เหรี
ยญสหรั
ฐ / ตั
นเที
ยบเท
าน้ํ
ามั
นดิ
บ : USD / Ton of Oil Equivalent (toe)
ป
/Year
ที่
มา: กรมพั
ฒนาพลั
งงานทดแทนและอนุ
รั
กษ
พลั
งงาน กระทรวงพลั
งงาน
Source: Department of Alternative Energy Development and Efficiency, Ministry of Energy.
พลั
งงาน
Energy
41


