17
เครื่
องชี้
ภาวะเศรษฐกิ
จไทย พ.ศ. 2562
หน้
า
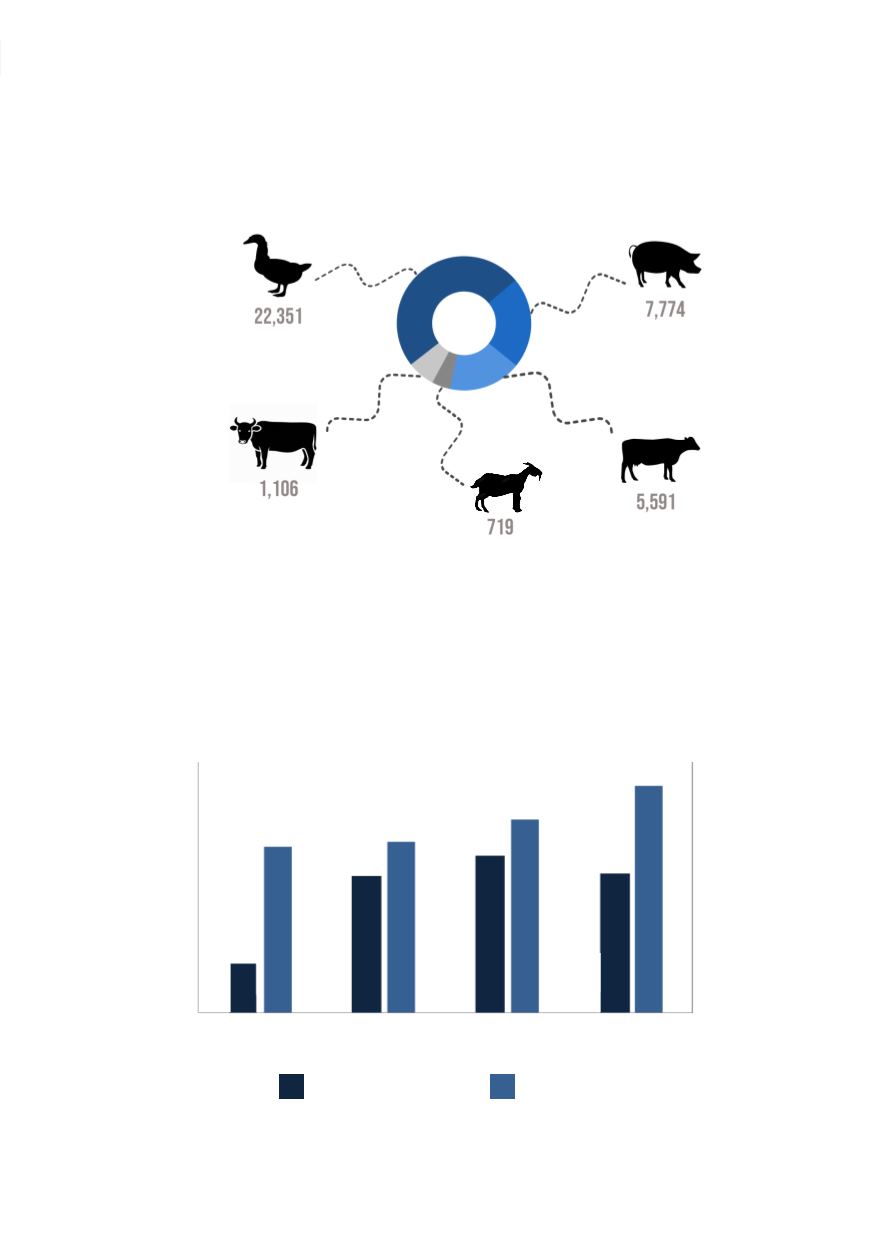
แผนภู
มิ
2.1 จ�
านวนปศุ
สั
ตว์
ที่
ส�
าคั
ญ พ.ศ. 2561
Chart 2.1 Number of Livestocks: 2018
แผนภู
มิ
2.2
ผลผลิ
ตและมู
ลค่
าผลผลิ
ตของ
ข้
าว (นาปี
และนาปรั
ง) พ.ศ. 2558 - 2561
Chart 2.2
Production and FarmGate Value of
Rice (Major and Second Rice): 2015 - 2018
ที่
มา: ส�
านั
กงานเศรษฐกิ
จการเกษตร กระทรวงเกษตรและสหกรณ์
Source: Office of Agricultural Economics, Ministry of Agriculture and Cooperatives
ที่
มา: ส�
านั
กงานเศรษฐกิ
จการเกษตร กระทรวงเกษตรและสหกรณ์
Source: Office of Agricultural Economics, Ministry of Agriculture and Cooperatives
หน่
วย (Unit): พั
นตั
ว (1,000 Heads/Birds)
ปี
Year
2558
2015
2559
2016
2560
2017
ผลผลิ
ต
Production
มู
ลค่
าผลผลิ
ต
Farm Gate Value
Meat Ducks and Layer Ducks
เป็
ดเนื้
อและเป็
ดไข่
กระบื
อ
Buffalo
สุ
กร
Swine
Cattle and Dairy Cow
โคเนื้
อและโคนม
แพะ
Goat
27,000
35,000
31,000
33,000
29,000
257,830
31,857
266,231
32,899
300,684
31,977
352,674
หน่
วย (Unit): ล้
านบาท (Million Bath)
2561
2018
50,000
100,000
350,000
250,000
300,000
200,000
150,000
400,000
หน่
วย (Unit): 1,000 ตั
น (1,000 Tons)
27,421


