22
Thai Economic Indicators 2019
หน้
า
ตาราง 2.4 ดั
ชนี
สิ
นค้
าเกษตรที่
ส�
าคั
ญ พ.ศ. 2555 - 2561
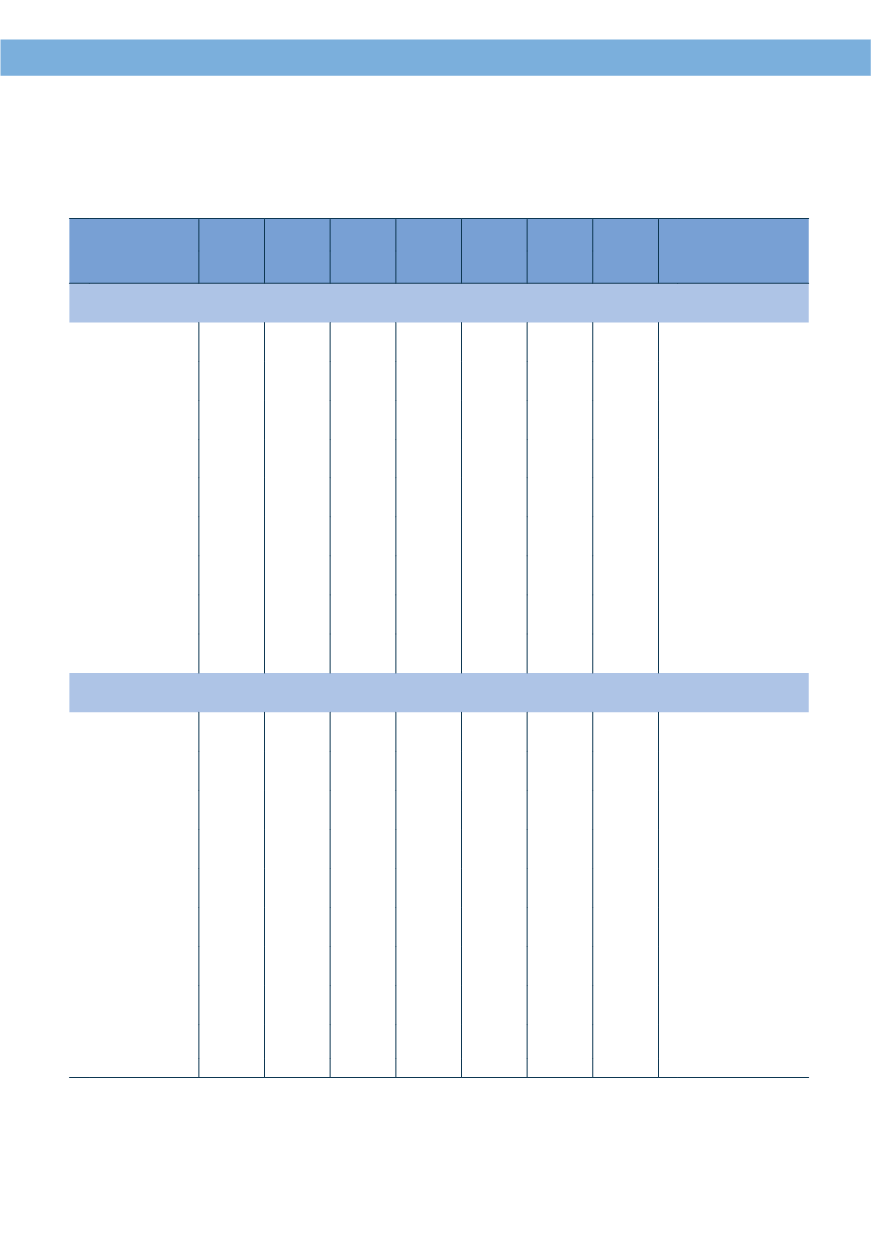
Table 2.4 Agricultural Index : 2012 - 2018
ปี
ฐาน = ปี
2548: Base Year = 2005
หมวด
2555
2012
2556
2013
2557
2014
2558
2015
2559
2016
2560
2017
2561
2018
Items
ดั
ชนี
ผลผลิ
ตสิ
นค้
าเกษตร
Agricultures Production Index
ภาคเกษตรกรรม 131.66 130.76 131.20 126.06 126.07 134.92 142.39 Agriculture
พื
ชอาหาร
143.10 140.41 134.00 121.99 115.29 124.08 132.94 Food Crops
พื
ชน�้
ามั
น 152.36 163.51 162.34 157.91 148.37 178.58 194.23 Oil Crops
ไม้
ผล
107.38 111.89 118.85 99.31 92.40 107.76 114.90 Fruit Trees
ไม้
ยื
นต้
น 138.01 148.37 156.02 155.83 153.39 159.01 171.00 Perennial Trees
ไม้
ดอก
81.99 104.41 109.77 109.38 103.13 100.49 106.92 Cut Flowers
พื
ชผั
ก
88.91 69.46 66.52 64.51 62.73 65.52 84.51 Vegetables
ปศุ
สั
ตว์
123.69 127.09 132.40 141.94 156.96 166.42 166.88 Livestock
ประมง
121.30 65.57 55.77 57.08 77.49 73.81 75.25 Fisheries
ดั
ชนี
มู
ลค่
าสิ
นค้
าเกษตร
Farm Value Index of Agricultures
ภาคเกษตรกรรม 202.81 199.49 188.09 170.13 175.66 182.76 181.95 Agriculture
พื
ชอาหาร
251.00 240.89 205.63 181.63 156.55 166.14 199.86 Food Crops
พื
ชน�้
ามั
น 264.33 236.07 284.32 258.29 321.53 313.63 247.86 Oil Crops
ไม้
ผล
160.31 181.97 220.55 197.46 228.16 220.01 222.50 Fruit Trees
ไม้
ยื
นต้
น 239.10 214.21 167.45 135.98 143.99 177.40 137.68 Perennial Trees
ไม้
ดอก
75.29 60.27 52.44 51.98 54.62 46.44 46.27 Cut Flowers
พื
ชผั
ก
114.75 99.52 80.09 98.42 136.92 158.43 141.72 Vegetables
ปศุ
สั
ตว์
140.75 162.16 184.07 182.31 203.24 199.32 188.98 Livestock
ประมง
126.19 105.94 101.90 84.04 114.43 112.17 93.43 Fisheries
ที่
มา: ส�
านั
กงานเศรษฐกิ
จการเกษตร กระทรวงเกษตรและสหกรณ์
Source: Of ce of Agricultural Economics, Ministry of Agriculture and Cooperatives


