21
เครื่
องชี้
ภาวะเศรษฐกิ
จไทย พ.ศ. 2562
หน้
า
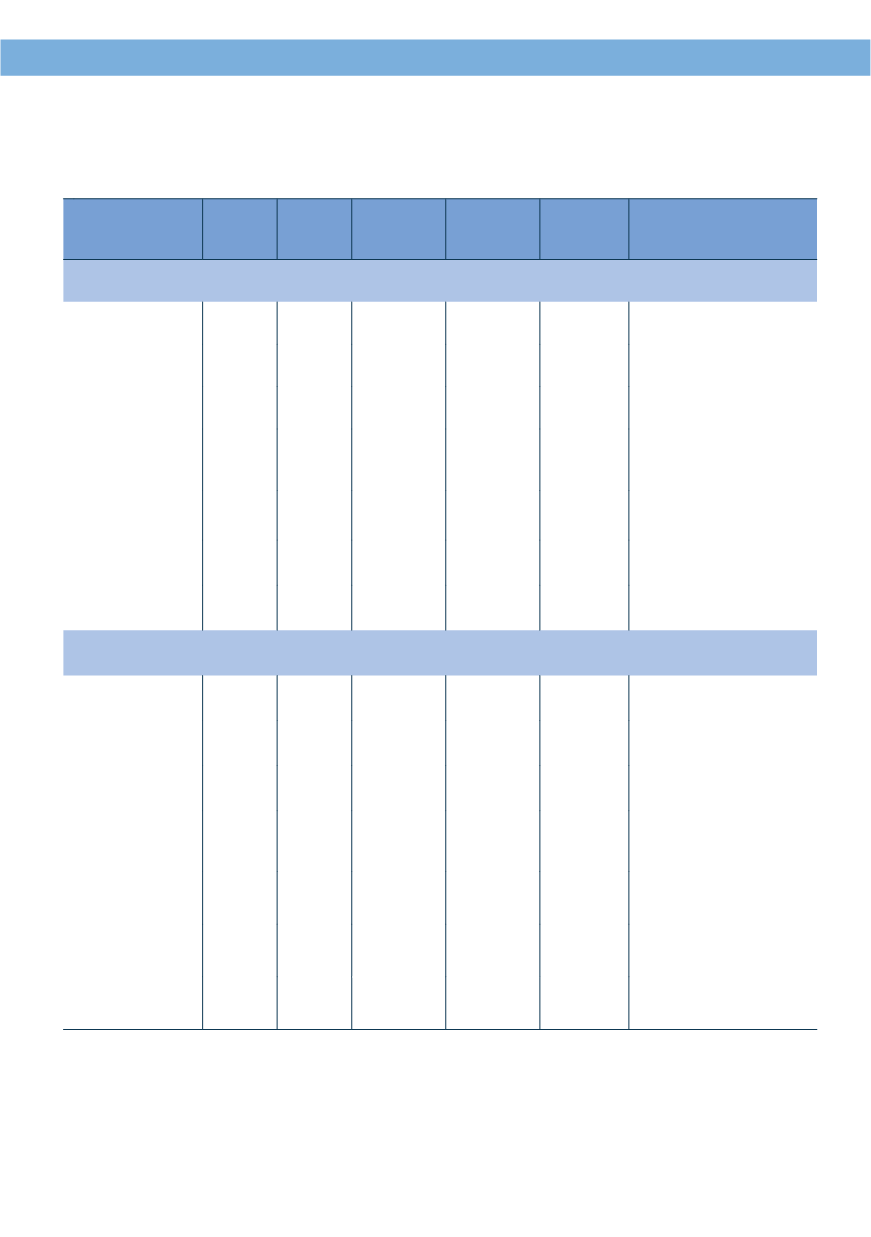
ตาราง 2.3 จ�
านวนปศุ
สั
ตว์
ที่
ส�
าคั
ญ พ.ศ. 2557 - 2561
Table 2.3 Number of Livestocks: 2014 - 2018
ปศุ
สั
ตว์
2557
2014
2558
2015
2559
2016
2560
2017
2561
2018
Livestocks
จ�
านวน (1,000 ตั
ว) Number (1,000 Heads/Birds)
โคเนื้
อ และโคนม 5,165 (p) 5,091 (p) 5,221 (p) 5,331 (p) 5,591 Cattle and Dairy Cows
กระบื
อ
1,020 947
909 (p) 1,011 (p) 1,106 Buffalo
สุ
กร
7,005 7,117
6,854
7,546 (p) 7,774 Swine
ไก่
เนื้
อและไก่
ไข่
(รวมไก่
พื้
นเมื
อง)
341,543 357,851 (p) 379,345 (p) 398,189 (p) 409,423 Brollers and Layer Hens
(included Native Chickens)
เป็
ดเนื้
อ และเป็
ดไข่
21,660 21,842 19,398 (p) 19,761 (p) 22,351 Meat Ducks and Layer Ducks
แพะ
468
539
-
652
719 Goat
แกะ
43
49
-
53
55
Sheep
ร้
อยละการเปลี่
ยนแปลง (%) Percent Change (%)
โคเนื้
อ และโคนม -7.1 -1.4
2.6
2.1
4.9 Cattle and Dairy Cows
กระบื
อ
-20.9 -7.2
-4.0
11.2
9.4 Buffalo
สุ
กร
-7.9
1.6
-3.7
10.1
3.0 Swine
ไก่
เนื้
อและไก่
ไข่
(รวมไก่
พื้
นเมื
อง)
0.2
4.8
6.0
5.0
2.8 Brollers and Layer Hens
(included Native Chickens)
เป็
ดเนื้
อ และเป็
ดไข่
-0.5
0.8
-11.2
1.9
13.1 Meat Ducks and Layer Ducks
แพะ
6.4 15.2
-
21.0
10.2 Goat
แกะ
4.4 12.6
-
7.6
4.9 Sheep
ที่
มา: ส�
านั
กงานเศรษฐกิ
จการเกษตร กระทรวงเกษตรและสหกรณ์
Source: Of ce of Agricultural Economics, Ministry of Agriculture and Cooperatives


